
Hello MarketShalians, I hope all of you are doing well. If we look at this week from the perspective of Indian markets, after a long time the Indian markets have given a positive close. Although now the selling by FIIs is continuing unhindered, but the selling intensity has reduced a bit. DIIs buy as much as FIIs sell. Meanwhile, newly appointed SEBI chief Tuhin Kant Pandey gave a speech in Money Control GWS 2025 that for India’s growth the support of foreign investors is needed and he will move forward together with FPIs and IAFs in this regard. His first move seems to be giving a good sign for the Indian markets. During the week another news regarding the Indian markets came from the RBI, RBI injected liquidity of INR 1.9 Lakh Crore to ease the stress of the banking system. If seen, the entire government machinery seems to be engaged in supporting the capital market and as an investor this is a good sign for you guys.
Now let’s talk about the commotion that is going to happen across the world. Trump’s tariff game is going on and the whole world is waiting to see what colour his reciprocal tariff game will show in April month. However, he has indicated in his speech that whichever countries have imposed heavy tariffs on the US, they will not shy away from imposing similar tariffs on those countries. In this context, India’s name is also coming up a lot, which has also been mentioned by Trump in his related speech. But this is a double-edged sword and its impact is being seen in the US markets. The performance of the U.S. capital markets has been negative this week but is it making any difference to Trump? His speeches indicate that all these things do not matter to him, he says he is not even looking at the U.S. markets, he believes that in the long term the positive impact of his policies is good for both the U.S. and its capital markets. Now only time will tell how good this will be; for now, nothing much good seems to be happening for them.
Talking about geopolitical affairs, then it does not seem that the efforts to end the Ukraine war will be that effective. While the U.S. has withdrawn its support from Ukraine, on the other hand the EU still seems to be standing strongly against Russia with extending support towards Ukraine. French President Macron’s statement this week in this regard proves that he will continue to support Ukraine with strength in the war against Russia. It will be interesting to see how Trump will deal with this challenge.
In this meantime, a major development was witnessed in the crypto currency world when Trump gave Bitcoin the status of a strategic reserve of the U.S. This step will now force the entire world to take a serious approach towards Bitcoin and its long-term positive impact will be seen on the crypto ecosystem.
So let’s now see what the price and action are saying about the different asset classes. What should be the approach of investors and traders on these asset classes in the coming week?
Table of Contents
US Stock Market and Dowjones Trade Probabilities
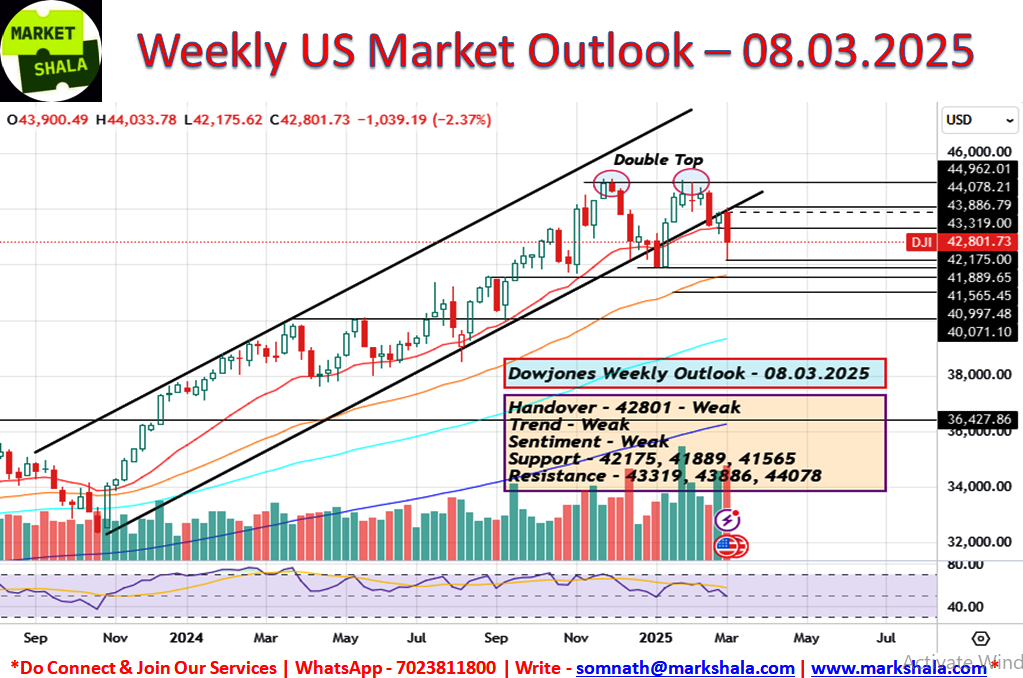
Dowjones witnessed a fall of -2.37% this week and selling pressure was seen near the resistance level 43884 as mentioned last week. The weekly chart of this week is showing a weakness in the Dowjones. The attempt to regain the long term bullish trend which was seen in last week’s chart, the price and action of Dowjones is failing in that this week. The double top formed near life highs is seen generating selling pressure. Hence, the strategy for next week should be to sell on rise. Whenever there is resistance formation near the below mentioned levels, Dowjones should be looked at taking a short side position next week.
Respective Resistance and Support Levels are as follows:
Support – 42175, 41889, 41565
Resistance – 43319, 43886, 44078
Sentiment – Weak
Trend – Weak
Trade Bias – Short (Conditional)
India Stock Market and Trade Probabilities
Nifty Outlook and Trade Probability
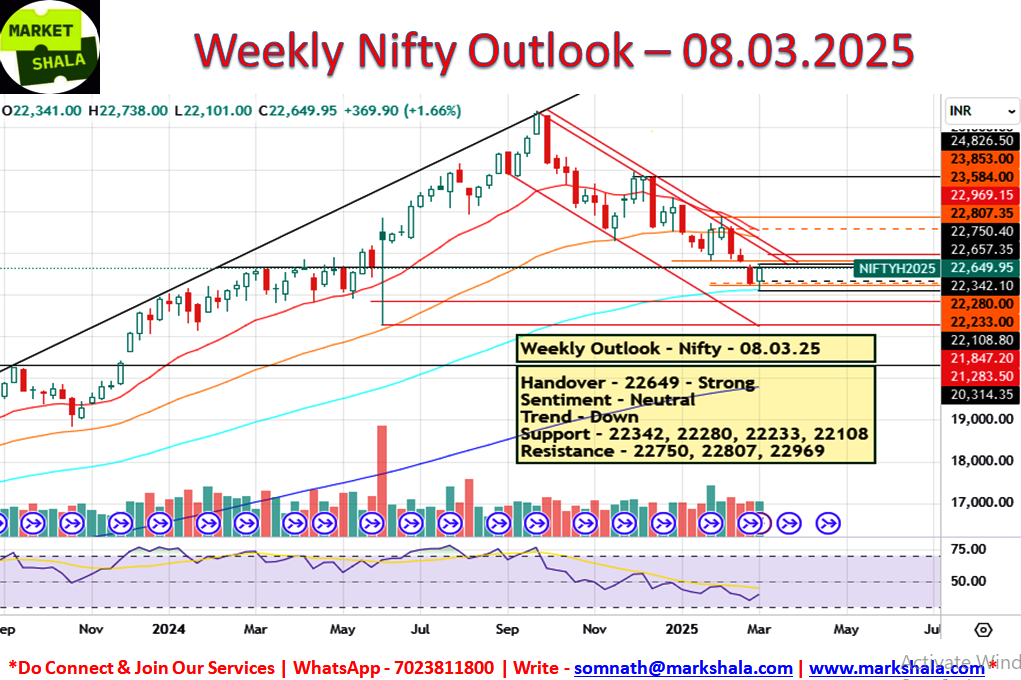
After 3 consecutive weeks of decline in Nifty, this week we saw a rise of 1.66%. The levels suggested last week were seen working well. Although, there is a rise in Nifty still this will be considered as a consolidation candle on the charts. A down trend formation which is running on the daily Nifty future chart, levels are currently standing in the mid of the channel.
Hence, our strategy to trade Nifty future next week will be on both sides whenever Nifty levels are found near the below given levels, from that we will find opportunities to trade on both sides according to the support and resistance formation.
Respective Resistance and Support Levels are as follows:
Support – 22342, 22280, 22233, 22108
Resistance – 22750, 22807, 22969
Sentiment – Neutral
Trend – Down
Trade Bias – Both Side (Conditional)
Bank Nifty Outlook and Trade Probability
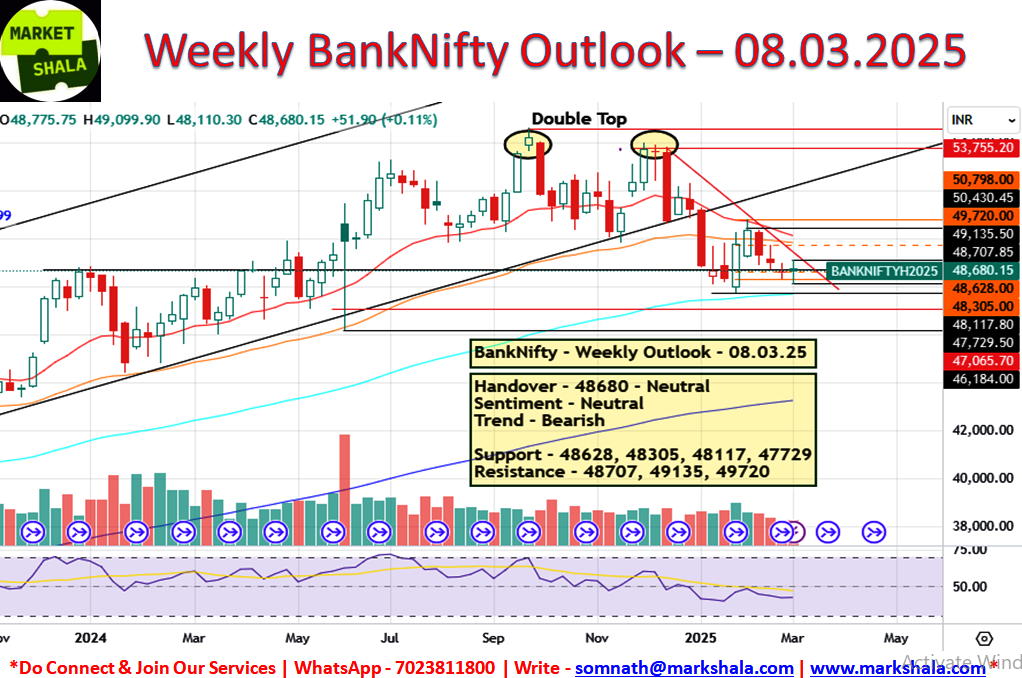
Another back to back second weak indecisive candle has formed in Bank Nifty. This has two meanings. The first is that Bank Nifty is not able to show strength to register an increase. The second meaning is that after a phase of fall, Bank Nifty is absorbing supply at the lower levels and is preparing to go up. When such a candle is formed after a big fall, its impact on the positive side gets considered more. Now whether this is a bottom formation, only time will tell.
For now, the trading strategy for next week should be to go with both side trades whenever Bank Nifty is seen near the below given support and resitance levels. There should be a caution also that if Bank Nifty reaches the daily closing level below to the 47729 then trading bias will switch to the Short side.
Respective Resistance and Support Levels are as follows:
Support – 48628, 48305, 48117, 47729
Resistance – 48707, 49135, 49720
Sentiment – Neutral
Trend – Bearish
Trade Bias – Both Sides (Conditional)
Stock of the week (Long/Short)
Long Side Trade
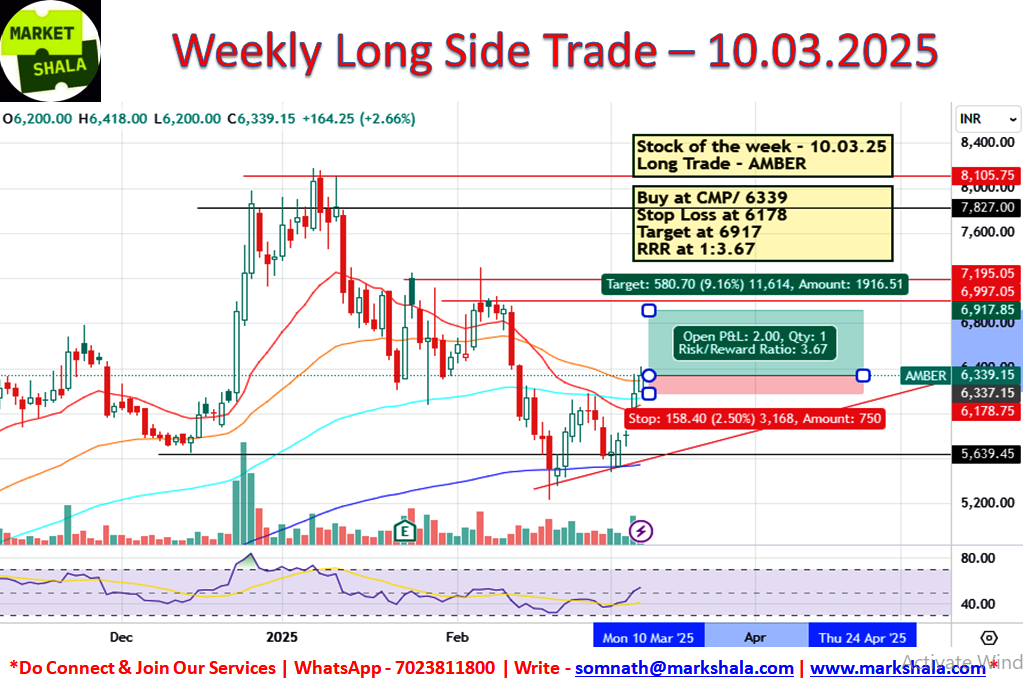
This week AMBER is coming in our setup where we will initiate the LONG side trade. Levels and Chart image is from the cash levels and it needs to be converted into the future levels if the position is being made in FnO. If it is not available in FnO then trade will be considered in the spot levels only.
Buy at the CMP / 6339.00, Stop Loss at 6178.00, Target at 6917.00 with a Risk Reward Ratio of 1:3.67
Short Side Trade
This week we haven’t got any Short Side Stock Trade idea into our setup and as we always say when your setup is not giving you trade better you stay away from taking trade. Because not taking trade is also equivalent to take trade in the trading business.
Alternative Investments
Gold Outlook and Trade Probability
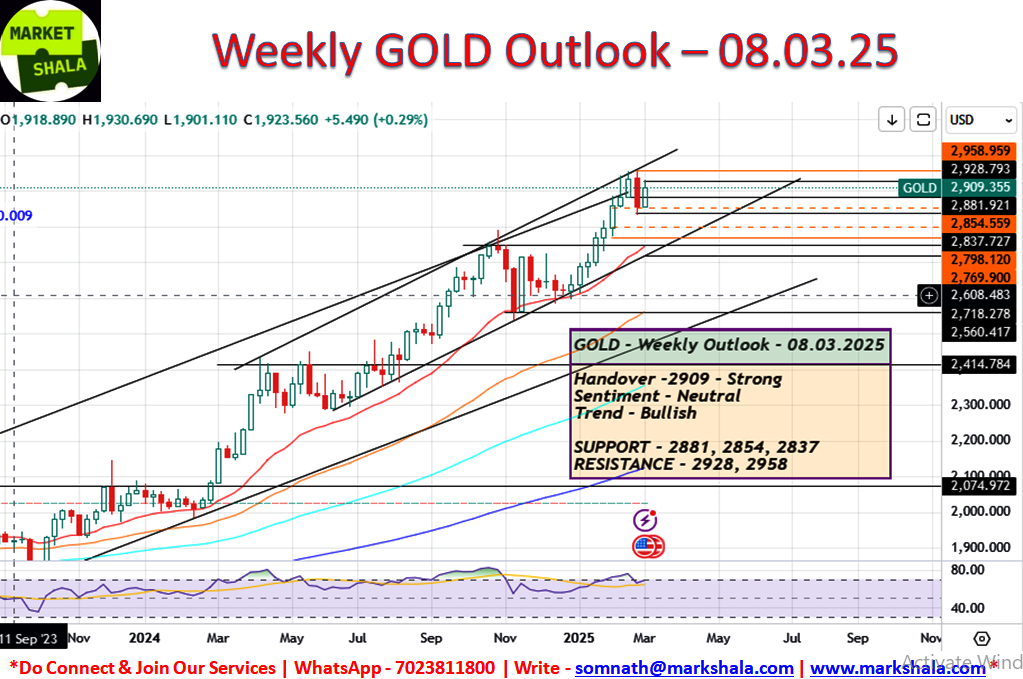
Gold is not ready to lose its strength despite facing selling pressure near all time high levels. This week a bullish candle was seen forming in Gold’s weekly price and action which once again brought it near the all time highs. We saw Gold prices were facing selling pressure from the mentioned last weak resistance level near $2936. Now it is a tug of war between Bears and Bulls which has been going on near all time highs for the last 4 weeks. As a trader must avoid to get trapped with a single side trading bias and we should look for an opportunity to trade Gold on both sides for next week whenever the price of Gold we is seen near the below given levels.
Respective Resistance and Support Levels are as follows:
Support – $2881, $2854, $2837
Resistance – $2928, $2958
Sentiment – Neutral
Trend – Bullish
Trade Bias – Both Side (Conditional)
Silver Outlook and Trade Probability
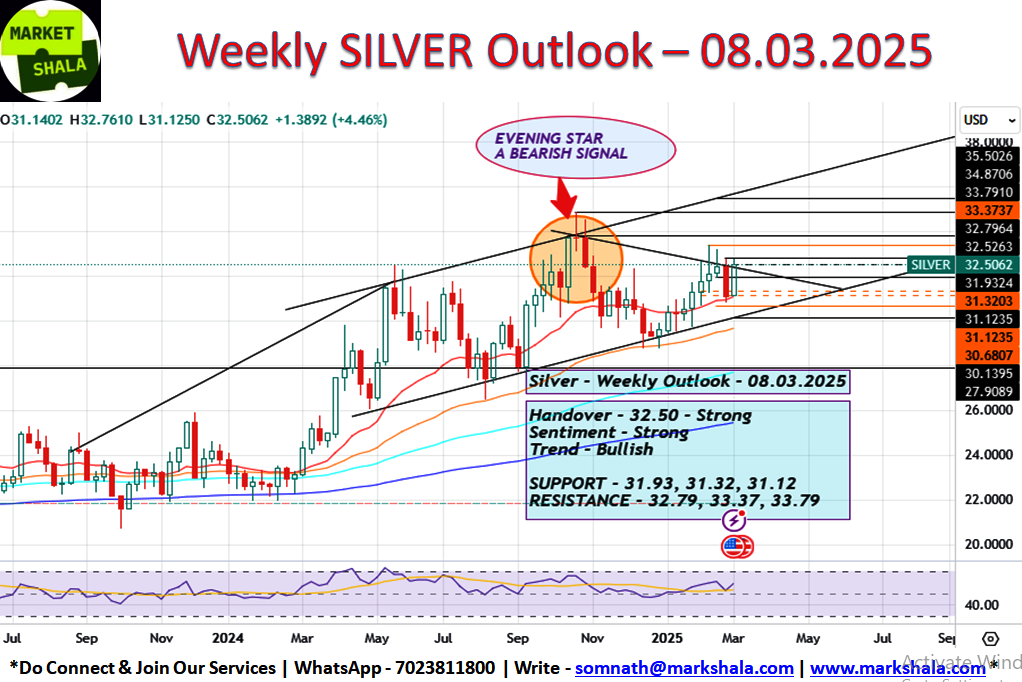
Silver posted tremendous gains this week and closed with a gain of 4.46%. Last week’s bearish candle has been completely recovered this week. The trend is bullish and the sentiments are strong. If Silver’s major resistance area at $33.79 gets breached once, you may see a fresh bullish run in Silver. Our trading bias for next week will remain on both sides because silver has not yet decisively broken the down trend line, the second reason is that the evening star pattern formed on the chart is still intact, the third reason is that if you observe closely you will find that silver has been facing a selling pressure near $32.79 level for the last 4 weeks but is unable to breach it. Hence due to these reasons we will look for opportunities to take trades near the below mentioned levels on both sides.
Respective Resistance and Support Levels are as follows:
Support – $31.93, $31.32, $31.12
Resistance – $32.79, $33.37, $33.79
Sentiment – Strong
Trend – Bullish
Trade Bias – Both Side (Conditional)
Crude Oil (WTI) Outlook and Trade Probability
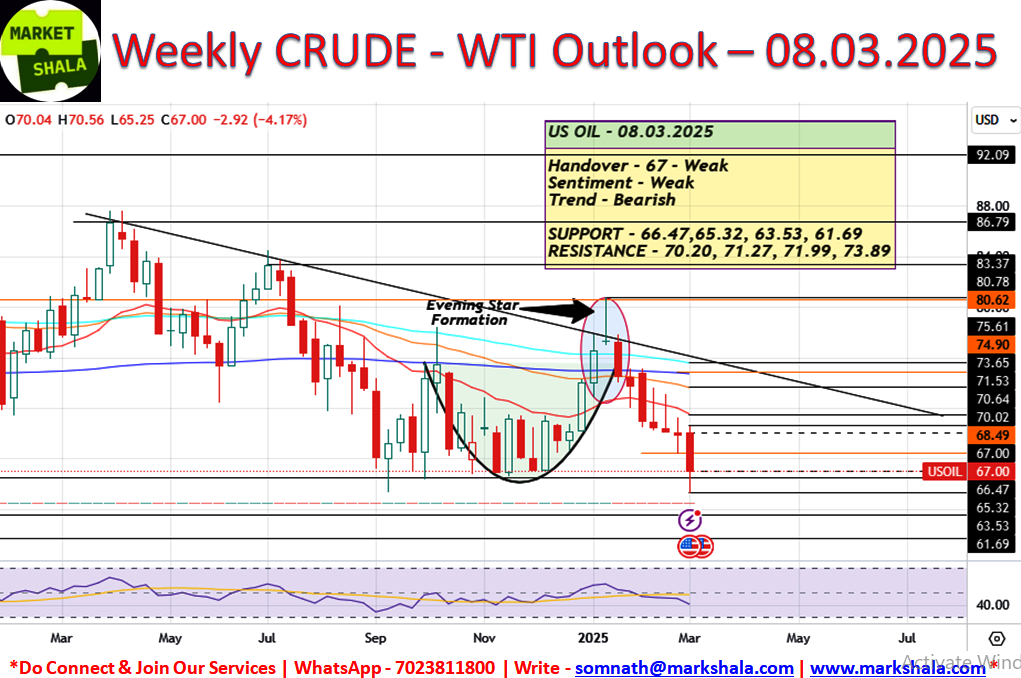
Crude Oil, I would like to say what a probability prediction we made last week, please give us a chance to pat our back! Jokes apart, I would just like to say that this is technical chart analysis and price and action power which you all can learn. Crude oil WTI index saw a fall of 4.17% this week. We had mentioned in our last week’s blog that we will look to book profit near $66.47. Crude price went below that and then saw a reversal from there. Now what next? Crude is trading above its strongest support at $66.47, so it would be unwise to short Crude here. If Crude closes below $66.47 on the daily charts from here, we will short it with a strict stop loss above $66.47 or adopt a sell on rise strategy near the levels given below.
Respective Resistance and Support Levels are as follows:
Support – $66.47, $65.32, $63.53, $61.69
Resistance – $70.20, $71.27, $71.99, $73.89
Sentiment – Weak
Trend – Bearish
Trade Bias – Short Side (Conditional)
Bitcoin Outlook and Trade Probability
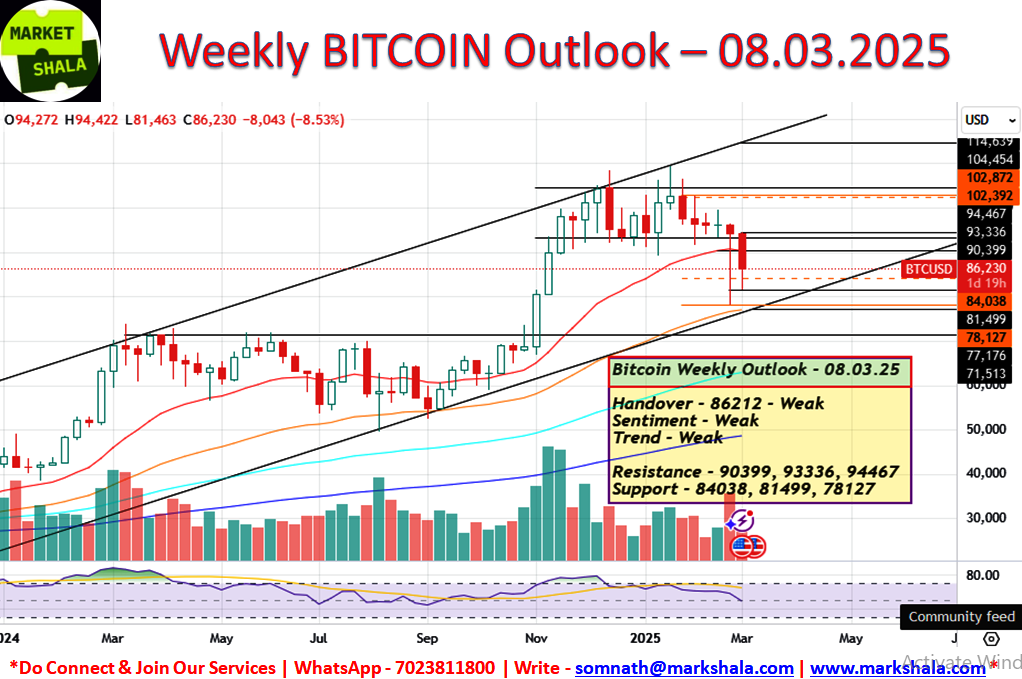
Bitcoin has been falling for the past six consecutive weeks and this week too it is witnessing a fall of -8.50%. Bitcoin is now also becoming a part of the strategic reserve of the U.S. and this is very positive news for Bitcoin. So creating a means to accumulate this near term fall will be a correct investment strategy. Those countries which were not taking Bitcoin seriously till now will now also be forced to think about it as the U.S. has stamped it as a strategic reserve asset for itself. Currently, the handover of Bitcoin, sentiment and trend all appear to be weak. In the coming week, we will keep an eye on its price and action to see what kind of price reversal signals will be found from this fall or not.
Respective Resistance and Support Levels are as follows:
Support – $84038, $81499, $78127
Resistance – $90399, $93336, $94467
Sentiment – Weak
Trend – Weak
Conclusion and disclaimer
The content on MarkShala.com is intended for educational and informational purposes only. We specialize in writing blogs on financial planning, investment strategies, economic trends, and related topics. While we strive to provide accurate and reliable information, the content should not be taken as professional financial, investment, or legal advice.
80% of Indians are NOT covered with proper Advisory for Wealth Creation, Right Insurance Protection and Financial Help!
Don’t be a part of the herd — take the first step and lead the way. Book a FREE call with MarketShala (WhatsApp – +91-7023811800 or Write at somnath@markshala.com) to learn more about the art of Right Investing, Insurance and find the best solution for you and your family.
Click Here and start your journey to invest in your first crypto currency.
Click Here and start your journey to invest in your first Stock, Index, Commodity and move ahead with your wealth creation journey.
How did you like our blog? Do share your thoughts in the comment box. Your thoughts will inspire us to bring more good and relevant content for you so that we can enhance the quality of our content and you can benefit more.
Thank you for tuning in to MarketShala’s Fin Dose — your essential source for insights into the financial markets, India and global economy, Don’t forget to share this story on your network.
Explore More on MarketShalaStay updated with insights on global events, market analysis, and investment strategies on Markshala, where we aim to make financial education accessible and actionable.Now, let’s shift gears and unwind! Treat yourself to the soothing tunes of MuziMuffin with his latest release available on Spotify, YouTube and Apple Music. Relax, recharge, and enjoy the vibe!
***********
|| ॐ नमः शिवाय ||