
Hello MarketShalians, Welcome to the Weekly Indian and World Market Wrap. This week started with a great enthusiasm, but its different impact was seen on the capital markets of the country and the world. The market has once again proved one thing, it is supreme. What you think, what reaction of which action do you want to see in the markets, it does not have much importance. On the other hand, if we talk about US markets, then Donald Trump’s tariff game attracted the attention of the markets of the whole world towards itself. Whether it was to put tariff on China and in return China was to implement tariff on the US and then invite the US for talks in the WTO on this issue. On the other hand the US decision to take back the tariffs which were imposed on Canada and Mexico. Everything was quite a drama. The US must have understood one thing that now the earlier thing is not there that it will one-sidedly show its power to the world and the entire world will bow its head and accept it. This is the era of globalization and everyone has the power to protect their own interests, now that power may be less with one country and more with another, which we can also call negotiation power. I would also like to say here that Donald Trump too is a skilled player, he too has to leave a legacy in his tenure, so his every step should be seen only in the interest of the US, due to which even if any other country suffers any loss, it should not be seen stepping back. Now, only time will tell how much benefit his actions will bring to the US!
If we talk about India, the entire week was full of very crucial activities. The annual central government budget was released, which according to information is one of the best budgets presented by the Indian government. The main headline of this budget was making employees salaried up to INR 12 Lakh tax free so as to put money in the hands of consumers. Other announcements were also made in this budget to bring the growth of Indian economy back on track. Then yesterday i.e. 07.02.25 RBI monetary policy came in which RBI announced a rate cut of 0.25 basis point. If seen, everything was good; the efforts of the government seem to be bringing the Indian economy on a positive side.
As it is said that equity markets are all about the current sentiments, the same was seen in the Indian markets too. Due to weak sentiments, the positive reaction that was expected from the markets was not seen. In all good things, when your mood is bad, you find some or the other bad and the markets have also done the same, whether it is about a little reduction in the government capital expenditure plans in the budget or the expectation of a little more from the RBI governor. But this is part of the game, when the positive sentiment in the bullish market overlooks even the biggest shortcomings and we do not have any remorse for it, then why should we worry now. This is a phase which will pass. While I am writing this blog for you, the vote counting for Delhi assembly elections is going on and BJP i.e. the running central government is seen to have formed a decisive lead with majority in it. Does the Indian market want this good news or is it ready to ignore this also on Monday?
Table of Contents
US Markets
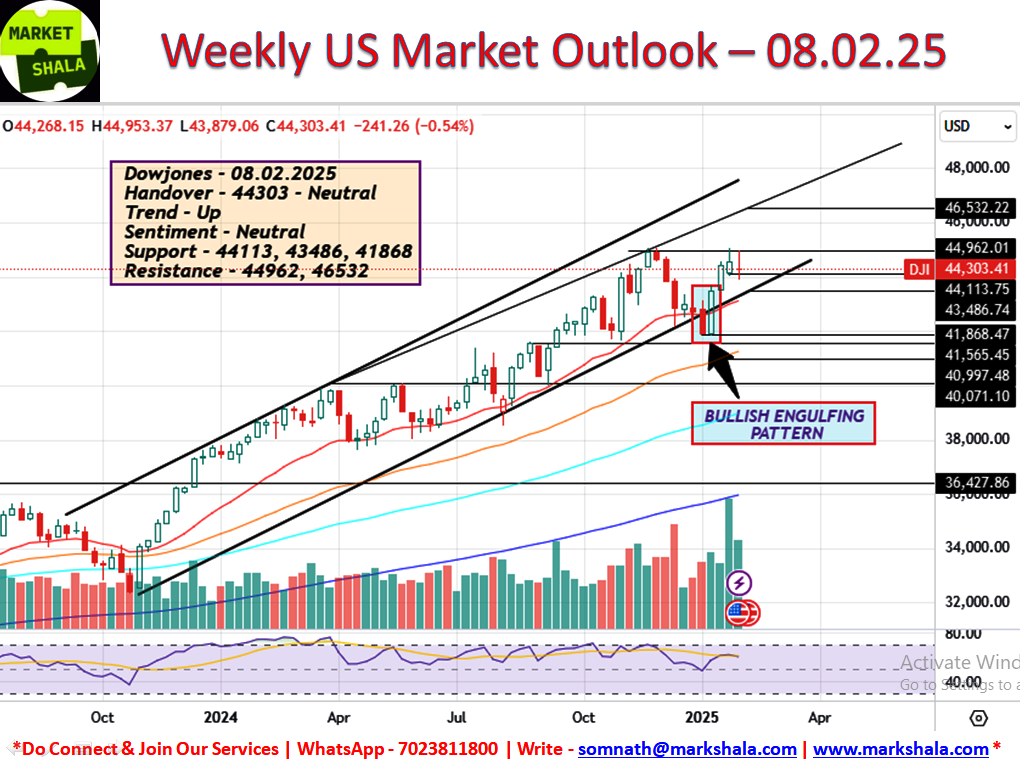
If we talk about US markets, they seem to be coming under the grip of selling pressure near life highs. This week the main US index Dowjones closed with a fall of -0.54% and -241 points. If we look at the weekly charts, an indecisive candle formation is visible. Due to this, the candle formation of next week becomes crucial. The direction in which the US markets move from here will have a great impact on the price and action of next week. For now, handover belongs to the neutral category and the uptrend is intact. Due to the current levels are being situate in between the trend band, the Dow Jones can show a both-way movement next week.
Respective Resistance and Support Levels are as follows:
Support – 44113, 43486, 41868
Resistance – 44962, 46532
Sentiment – Strong
Trend – Up
Trade Bias – Both Side
India Market
Nifty Outlook and Trade Probability
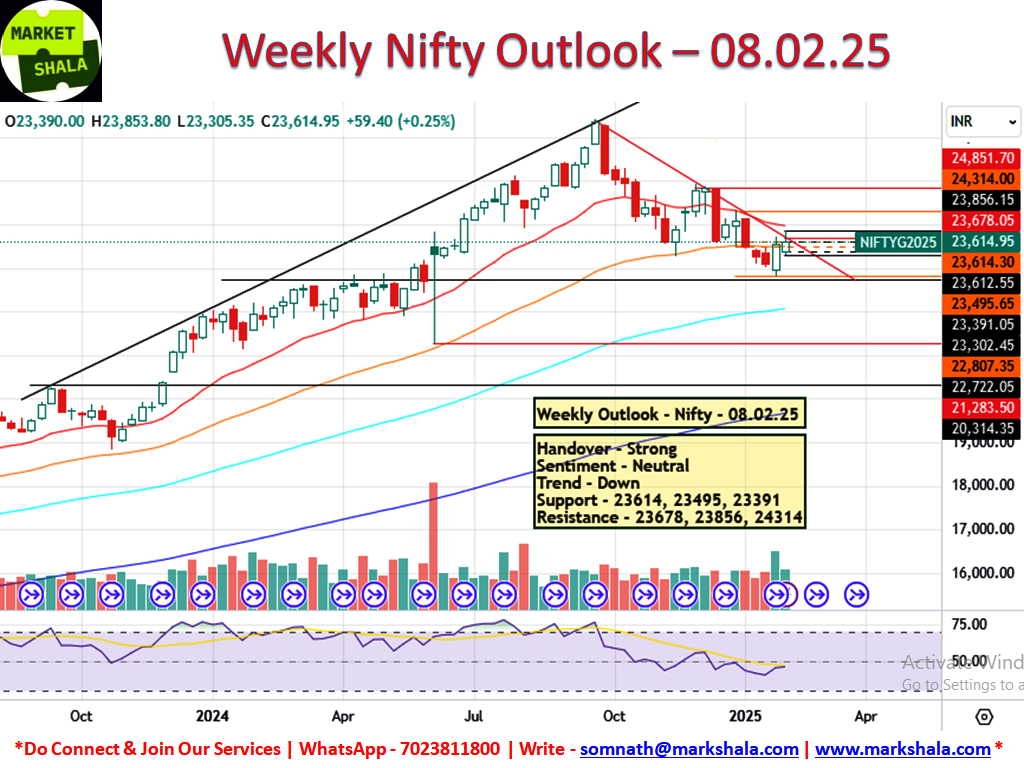
Nifty future however did not show the expected up-move this week but closed with a gain of 0.25% and 59 points on the weekly charts. The situation on the charts is looking strong. A higher high and higher low candle formation was seen this week which is a positive indication. Down trend is still intact. Relative strength index is formed below 50 which is a sign of weakness. What I mean to say is that the criteria which should be seen on the charts to see a decisive positive strength have not been seen yet. So traders should maintain trading bias on short side till they get daily close above 23678 and once this level is achieved on daily close, opportunities to trade on both sides at the below given levels should be followed next week.
Respective Resistance and Support Levels are as follows:
Support – 23614, 23495, 23391
Resistance – 23678, 23856, 24314
Sentiment – Neutral
Trend – Down
Trading Bias – Short Side – Conditionally
Click Here and start your journey to invest in your first Stock, Index, Commodity and move ahead with your wealth creation journey.
Bank Nifty Outlook and Trade Probability
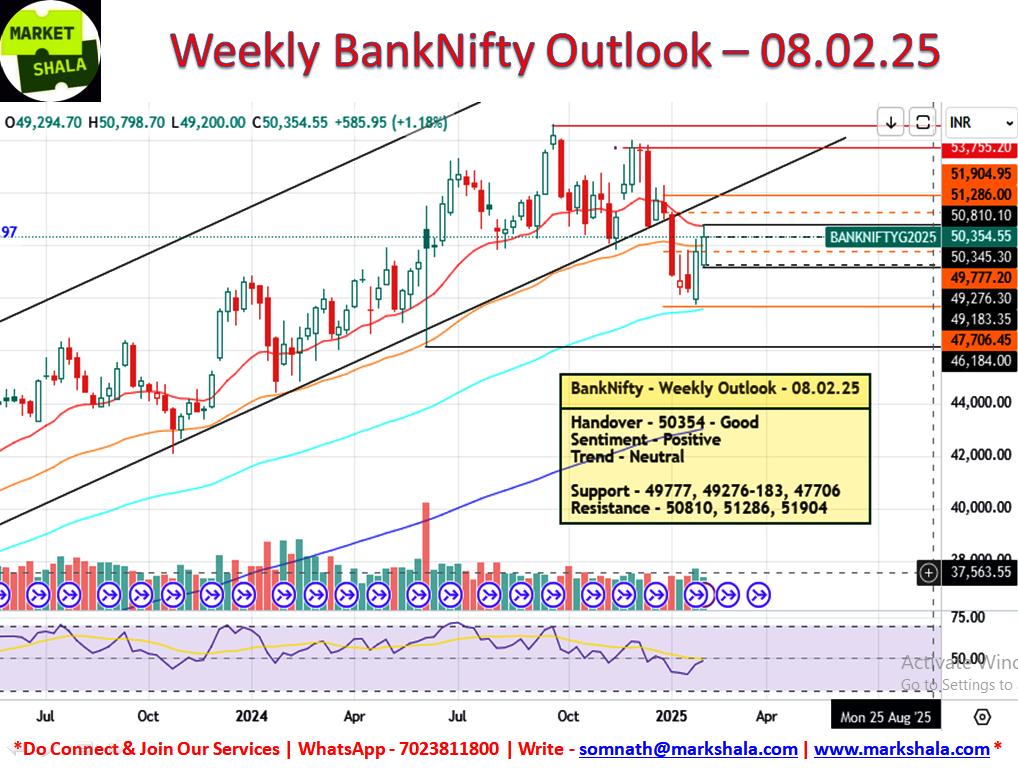
Bank Nifty witnessed a gain of 1.18% and 585 points this week. The weekly chart of Bank Nifty however is not showing any trend formation but this week’s candles have formed higher highs and higher lows along with good gains which is a positive sign. The relative strength index is situated at 50 which indicate strength gaining process of Bank Nifty or in other words, it is standing at the make or break point of RSI. The first hurdle is visible in front of Bank Nifty in the form of 20 WEMA from where it faced selling pressure this week also. In the absence of any decisive trend, the trading bias is to take trades on both sides around the levels given below.
Respective Resistance and Support Levels are as follows:
Support – 49777, 49276-183, 47706
Resistance – 50810, 51286, 51904
Sentiment – Positive
Trend – Neutral
Trading Bias – Both Side
Stock of the week (Long/Short)
Long Side Trade
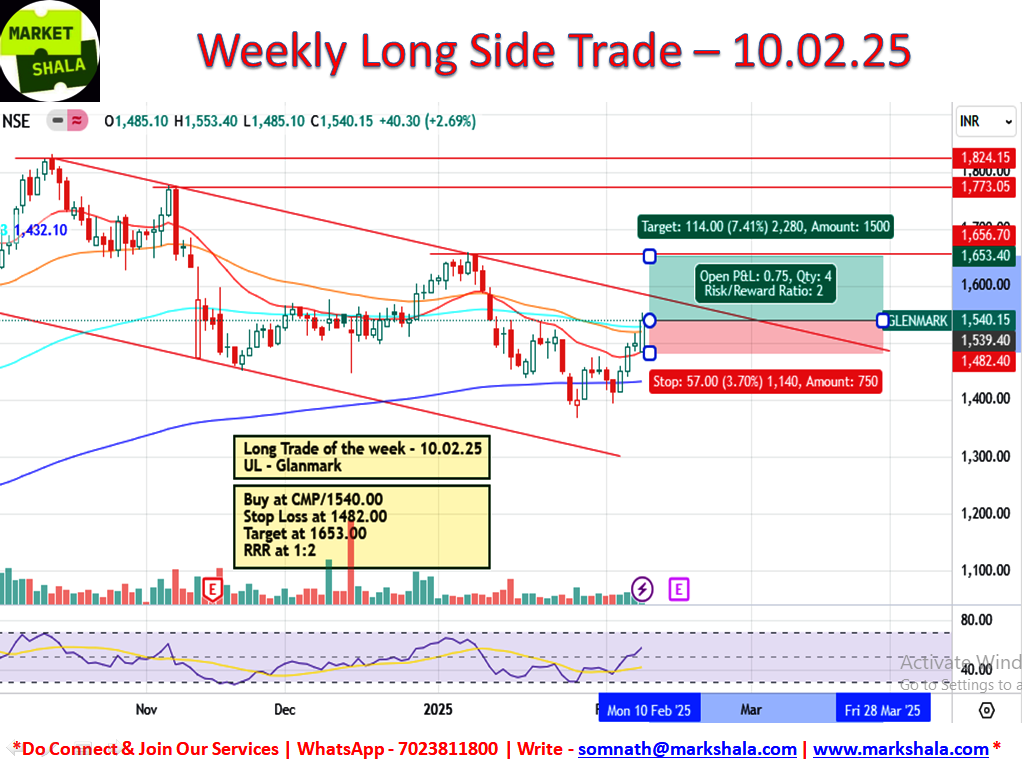
This week GLANMARK is coming in our setup where we will initiate the LONG side trade. Levels and Chart image is from the cash levels and it needs to be converted into the future levels if the position is being made in FnO. If it is not available in FnO then trade will be considered in the spot levels only.
Buy at the CMP / 1540.00, Stop Loss at 1482.00, Target at 1653.00 with a Risk Reward Ratio of 1:2
Short Side Trade
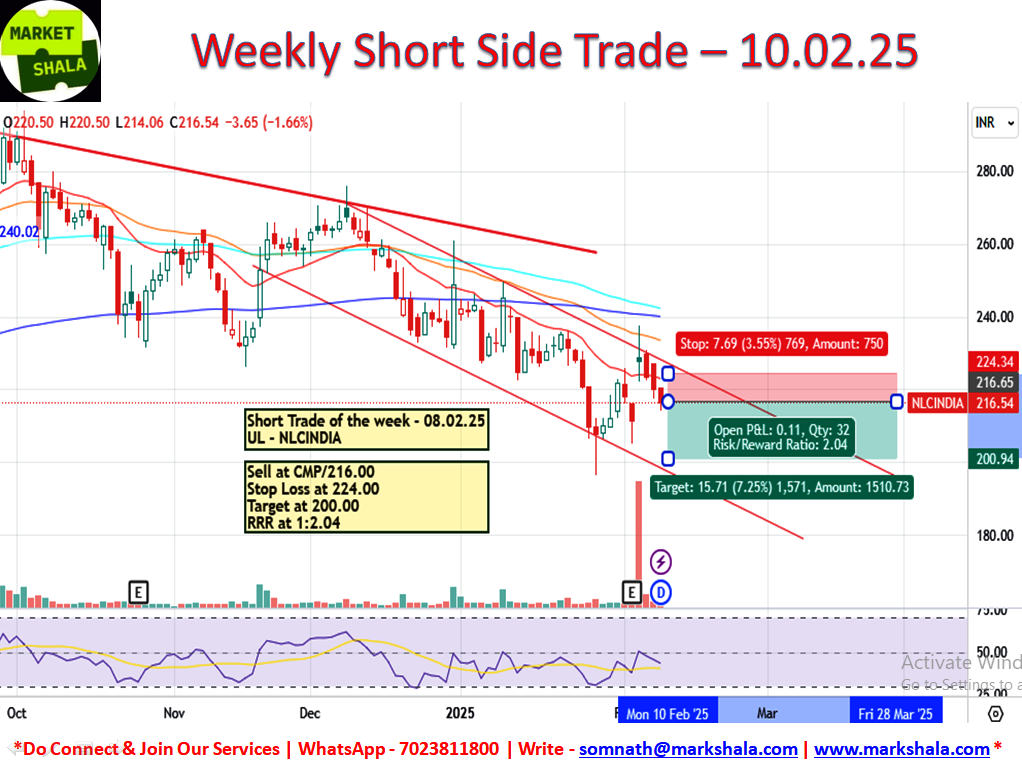
This week NLCINDIA is coming in our setup where we will initiate the SHORT side trade. Levels and Chart image is from the cash levels and it needs to be converted into the future levels.
Sell at the CMP/216.00, Stop Loss at 224.00, Target at 200.00 with a Risk Reward Ratio of 1:2.04
Alternative Investments
Gold Outlook and Trade Probability
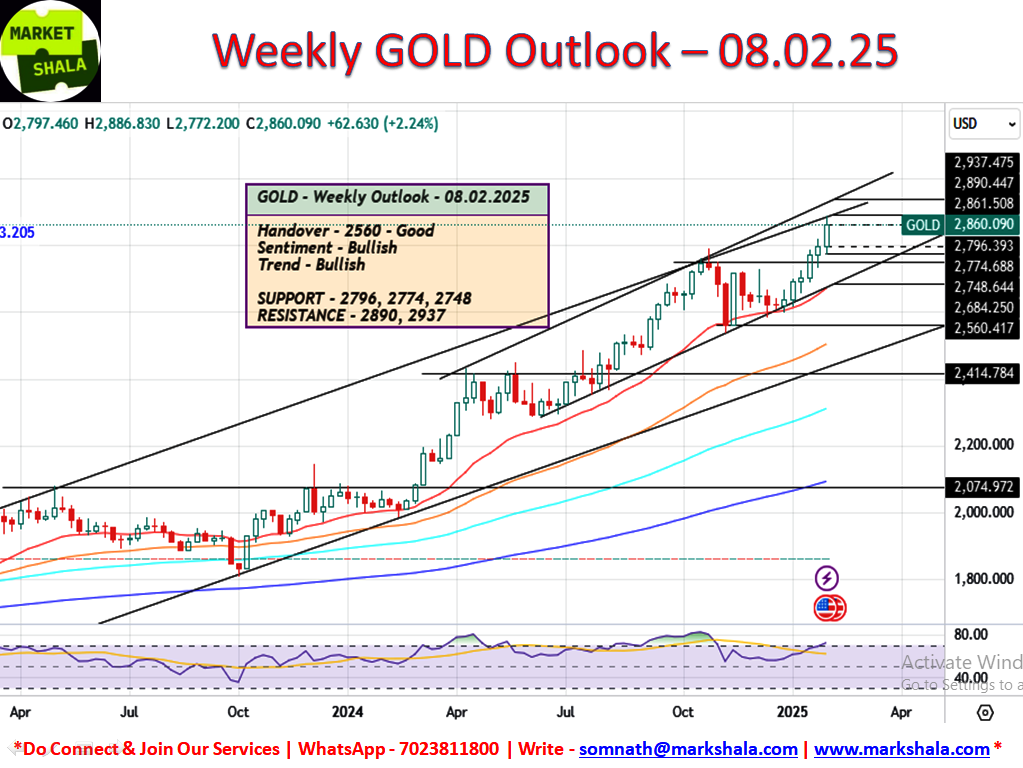
Gold’s Bull Run is continuing. Uncertainties in world equity and currency markets are seen giving a push to gold. This week gold made new life highs with a gain of 2.24%. We should follow the trend in gold till it does not give any signs of reversal and no such signs are visible yet on the weekly charts. For next week also gold has to be traded with a trading bias on the long side. The strategy of going long in gold whenever an opportunity arises around the levels given below can remain profitable in next week as well.
Respective Resistance and Support Levels are as follows:
Support – $2796, $2774, $2748
Resistance – $2890, $2937
Sentiment – Positive
Trend – Bullish
Trading Bias – Long Side
Silver Outlook and Trade Probability
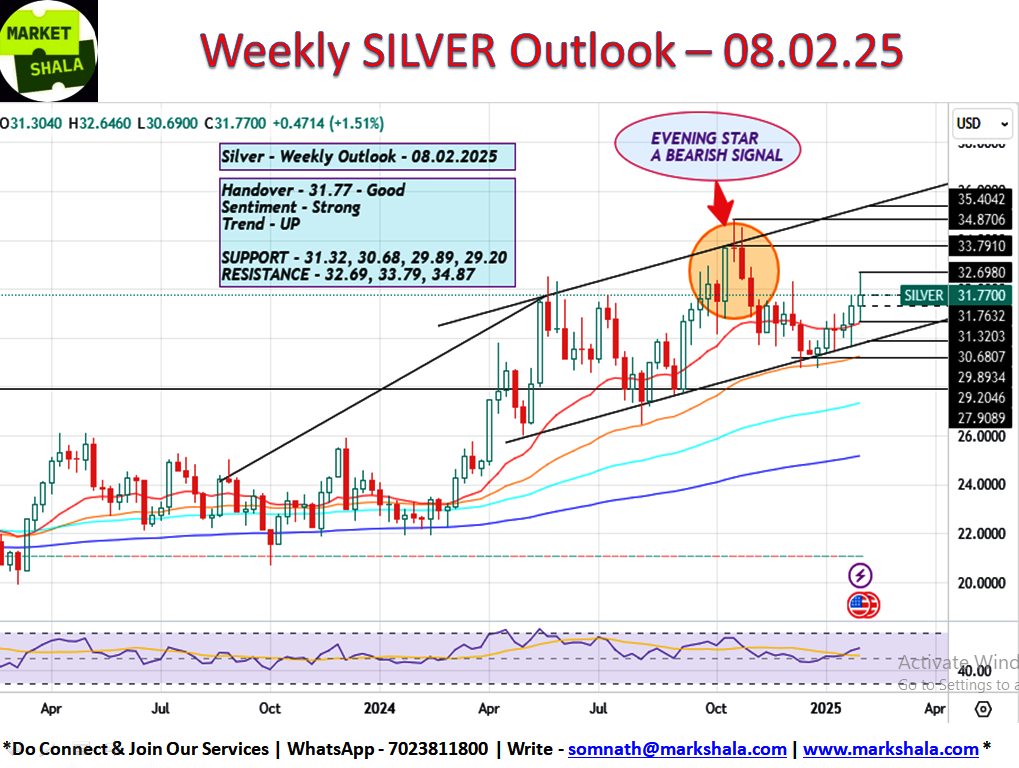
Silver is also seen slowly increasing its pace. However, there is a little more volatility in it. This week silver closed with a gain of 1.51% and a good rounding bottom formation is seen forming on the chart. Silver should be traded with a long side bias for the next week. Whenever there is an opportunity near the below given levels, the strategy of taking long side trades may prove to be effective.
Respective Resistance and Support Levels are as follows:
Support – $31.32, $30.68, $29.89, $29.20
Resistance – $32.69, $33.79, $34.87
Sentiment – Positive
Trend – Bullish
Trading Bias – Long Side
Crude Oil (WTI) Outlook and Trade Probability
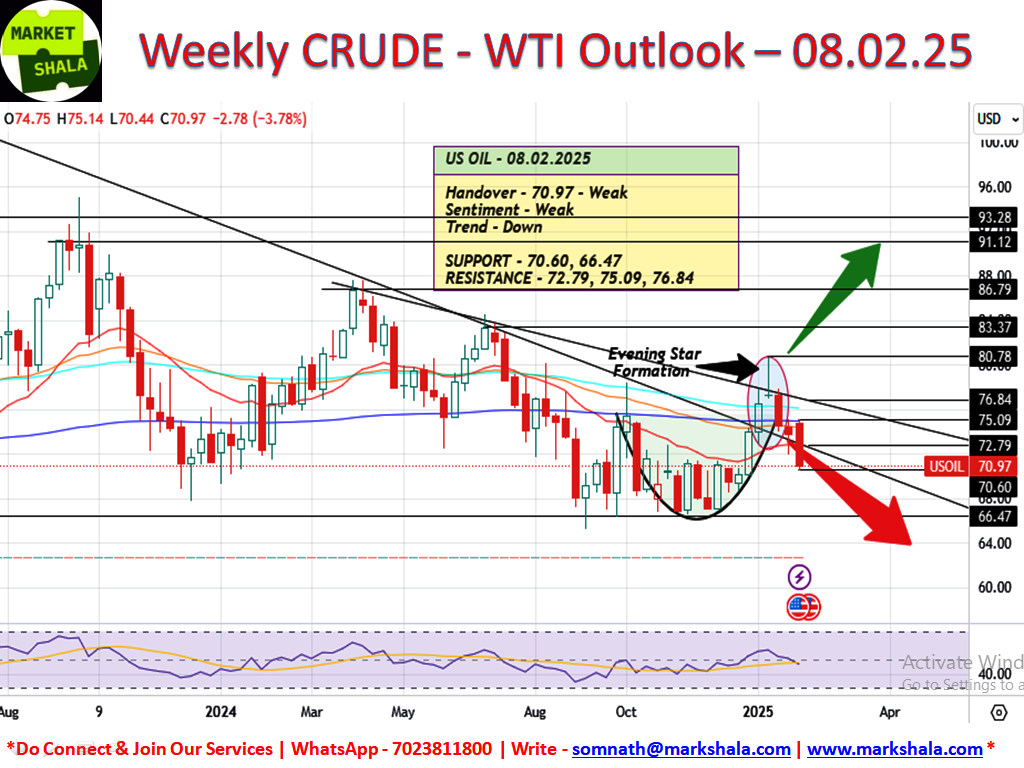
Crude oil showed weakness as expected and closed the week with a major weakness of -3.78%. Crude broke its important support on the weekly chart and entered the old downtrend zone, which will act as a resistance against it in the coming week. RSI levels have come below 50 on the weekly chart and now chances of crude reaching the major support of $66.47 have increased.
Next week the trading strategy should be on the short side only. Opportunities should be found to short crude oil whenever available near the levels given below.
Respective Resistance and Support Levels are as follows:
Support – $70.60, $66.47
Resistance – $72.79, $75.09, $76.84
Sentiment – Weak
Trend- Down
Trading Bias – Short Side
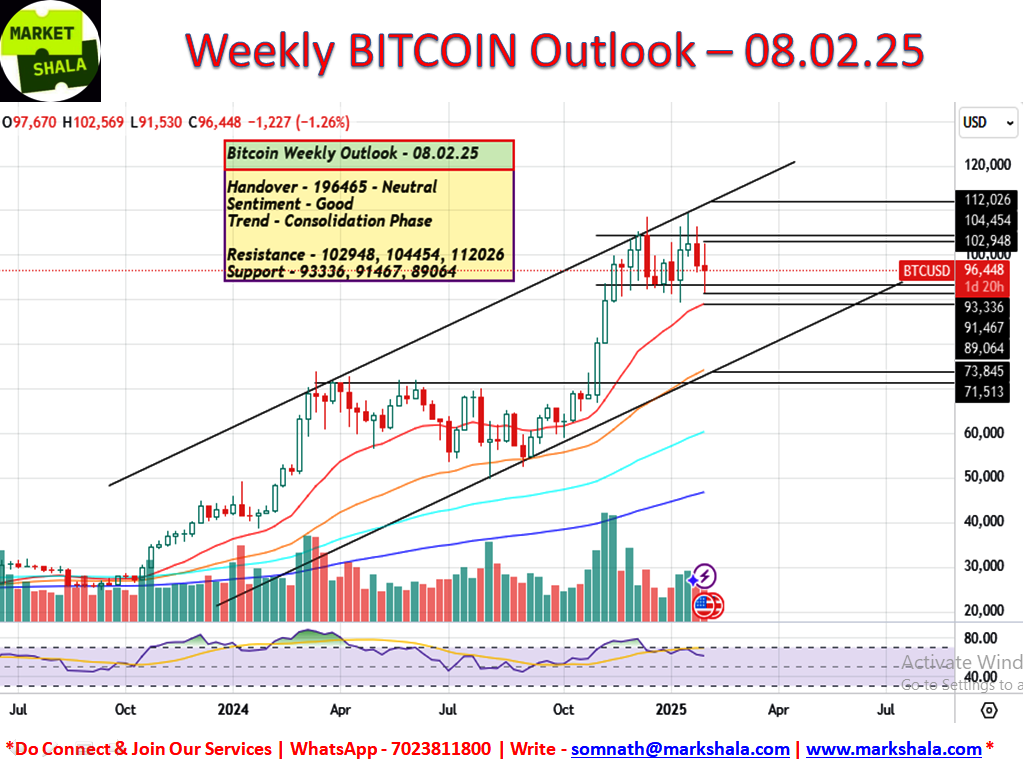
Bitcoin Outlook and Trade Probability
Bitcoin showed heavy volatility this week. Due to which people who trade cryptocurrency may have suffered huge losses or may also make huge profits. Because under such conditions it is very difficult to create any setup from short term trading point of view. Its volatility has the ability to break your setup on both sides, as we saw this week. But it also has a positive view point if you look at the larger time horizon and willing to give a 5 to 10% allocation to Bitcoin in your financial portfolio by following the levels on the weekly and monthly charts, then doing so also serves to give your portfolio an additional edge. As seen this time too, the accumulation around the levels would have improved the average buying cost of Bitcoin and strengthened your portfolio.
Bitcoin registered a weekly decline of -1.26% this week and is seen trading above the levels giving indecisive candle formation. Bitcoin has been in a consolidation phase for the last 2 months. If the required allocation of Bitcoin is still remaing in your portfolio, then buy it whenever it comes to the lower levels of this consolidation band and wait for the breakout above its life highs.
Respective Resistance and Support Levels are as follows:
Support – $93336, $91467, $89064
Resistance – $102948, $104454, $112026
Sentiment – Positive
Trend – Consolidation Phase
Trading Bias – Accumulate for the long term portfolio
Click Here and start your journey to invest in your first crypto currency.
Conclusion and disclaimer
The content on MarkShala.com is intended for educational and informational purposes only. We specialize in writing blogs on financial planning, investment strategies, economic trends, and related topics. While we strive to provide accurate and reliable information, the content should not be taken as professional financial, investment, or legal advice.
How did you like our blog? Do share your thoughts in the comment box. Your thoughts will inspire us to bring more good and relevant content for you so that we can enhance the quality of our content and you can benefit more.
Thank you for tuning in to MarketShala’s Fin Dose — your essential source for insights into the financial markets, India and global economy, Don’t forget to share this story on your network.
Explore More on MarketShala
Stay updated with insights on global events, market analysis, and investment strategies on Markshala, where we aim to make financial education accessible and actionable. Now, let’s shift gears and unwind! Treat yourself to the soothing tunes of MuziMuffin with his latest release available on Spotify, YouTube and Apple Music. Relax, recharge, and enjoy the vibe!
Hindi Translation of the Story
हिंदी अनुवाद
साप्ताहिक शेयर बाजार की समीक्षा: भारत और वैश्विक रुझान – विजेता, हारने वाले, और आगे क्या – 08.02.2025!
नमस्कार मार्केटशालियन्स, साप्ताहिक भारतीय और विश्व बाजार समीक्षा में आपका स्वागत है। इस सप्ताह की शुरुआत तो बहुत उत्साह के साथ हुई, लेकिन इसका अलग ही असर देश और दुनिया के पूंजी बाजारों पर देखने को मिला। बाजार ने एक बार फिर एक बात साबित कर दी, वह सर्वोच्च है। आप क्या सोचते हैं, बाजारों में किस क्रिया की क्या प्रतिक्रिया देखना चाहते हैं, इसका ज्यादा महत्व नहीं है। वहीं अगर अमेरिकी बाजारों की बात करें, तो डोनाल्ड ट्रंप के टैरिफ गेम ने पूरी दुनिया के बाजारों का ध्यान अपनी ओर खींचा। चाहे वह चीन पर टैरिफ लगाना हो और बदले में चीन का अमेरिका पर टैरिफ लागू करना हो और फिर इस मुद्दे पर डब्ल्यूटीओ में अमेरिका को बातचीत के लिए आमंत्रित करना हो। दूसरी ओर कनाडा और मैक्सिको पर लगाए गए टैरिफ को वापस लेने का अमेरिका का फैसला। सब कुछ काफी नाटकीय रहा। अमेरिका को एक बात समझ में आ गई होगी कि अब पहले वाली बात नहीं रही कि वह एकतरफा तरीके से दुनिया को अपनी ताकत दिखाएगा और पूरी दुनिया सिर झुकाकर उसे स्वीकार कर लेगी। यह वैश्वीकरण का युग है और हर किसी के पास अपने हितों की रक्षा करने की शक्ति है, अब वह शक्ति एक देश के पास कम और दूसरे के पास ज्यादा हो सकती है, जिसे हम बातचीत की शक्ति भी कह सकते हैं। मैं यहां यह भी कहना चाहूंगा कि डोनाल्ड ट्रंप भी एक माहिर खिलाड़ी हैं, उन्हें भी अपने कार्यकाल में विरासत छोड़नी है, इसलिए उनका हर कदम अमेरिका के हित में ही देखा जाना चाहिए, जिससे अगर किसी दूसरे देश को कोई नुकसान भी होता है तो वह पीछे हटता हुआ नहीं दिखना चाहिए। अब यह तो वक्त ही बताएगा कि उनके इन कदमों से अमेरिका को कितना फायदा होगा!
भारत की बात करें तो पूरा सप्ताह काफी अहम गतिविधियों से भरा रहा। केंद्र सरकार का वार्षिक बजट जारी किया गया, जो जानकारी के अनुसार भारत सरकार द्वारा पेश किए गए सबसे बेहतरीन बजटों में से एक है। इस बजट की मुख्य हेडलाइन 12 लाख रुपये तक के वेतन वाले कर्मचारियों को कर मुक्त करना था ताकि उपभोक्ताओं के हाथ में पैसा पहुंचे। इस बजट में भारतीय अर्थव्यवस्था की वृद्धि को पटरी पर लाने के लिए अन्य घोषणाएं भी की गईं। फिर कल यानी 07.02.25 को RBI की मौद्रिक नीति आई जिसमें RBI ने 0.25 आधार अंकों की दर में कटौती की घोषणा की। देखा जाए तो सब कुछ अच्छा रहा, सरकार के प्रयासों से भारतीय अर्थव्यवस्था सकारात्मक दिशा में आती दिख रही है। लेकिन कहते हैं कि शेयर बाजार मौजूदा भावनाओं पर ही निर्भर करता है, भारतीय बाजारों में भी यही देखने को मिला। कमजोर भावनाओं के कारण बाजारों से जिस सकारात्मक प्रतिक्रिया की उम्मीद थी, वह देखने को नहीं मिली। सभी अच्छी चीजों में, जब आपका मूड खराब होता है, तो आप कुछ न कुछ बुरा ढूंढ ही लेते हैं और बाजारों ने भी वही किया है, चाहे वह बजट में सरकारी पूंजीगत व्यय योजनाओं में थोड़ी कटौती की बात हो या RBI गवर्नर से थोड़ी अधिक की उम्मीद की बात हो। लेकिन यह खेल का हिस्सा है, जब तेजी वाले बाजार में सकारात्मक भावना बड़ी से बड़ी कमियों को भी नजरअंदाज कर देती है और हमें इसका कोई पछतावा नहीं होता, तो अब हमें क्यों चिंता करनी चाहिए। यह एक ऐसा दौर है जो बीत जाएगा। जब मैं आपके लिए यह ब्लॉग लिख रहा हूँ, तब दिल्ली विधानसभा चुनाव के लिए मतगणना चल रही है और भाजपा यानी केंद्र में चल रही सरकार बहुमत के साथ निर्णायक बढ़त बनाती दिख रही है। क्या भारतीय बाजार इस खुशखबरी की चाहत रखता है या फिर सोमवार को भी इसे नज़रअंदाज़ करने को तैयार है?
अमेरिकी बाजार
अगर हम अमेरिकी बाजारों की बात करें तो वे जीवन के उच्चतम स्तर के करीब बिकवाली के दबाव की चपेट में आते दिख रहे हैं। इस सप्ताह मुख्य अमेरिकी सूचकांक डाउ जोन्स -0.54% और -241 अंकों की गिरावट के साथ बंद हुआ। साप्ताहिक चार्ट पर नजर डालें तो एक अनिश्चित कैंडल फॉर्मेशन दिखाई दे रहा है। इसके कारण अगले सप्ताह का कैंडल फॉर्मेशन महत्वपूर्ण हो जाता है। यहां से अमेरिकी बाजार किस दिशा में आगे बढ़ेंगे, इसका अगले सप्ताह की कीमत और कार्रवाई पर बहुत प्रभाव पड़ेगा। फिलहाल, हैंडओवर तटस्थ श्रेणी में है और अपट्रेंड बरकरार है। मौजूदा स्तरों के ट्रेंड बैंड के बीच में स्थित होने के कारण, डाउ जोन्स अगले सप्ताह दोनों तरफ की चाल दिखा सकता है। संबंधित प्रतिरोध और समर्थन स्तर इस प्रकार हैं:
समर्थन – 44113, 43486, 41868
प्रतिरोध – 44962, 46532
भावना – मजबूत
रुझान – ऊपर
व्यापार पूर्वाग्रह – दोनों तरफ
भारत बाजार
निफ्टी आउटलुक और व्यापार संभावना
निफ्टी फ्यूचर ने हालांकि इस सप्ताह अपेक्षित अप-मूव नहीं दिखाया, लेकिन साप्ताहिक चार्ट पर 0.25% और 59 अंकों की बढ़त के साथ बंद हुआ। चार्ट पर स्थिति मजबूत दिख रही है। इस सप्ताह एक उच्च उच्च और उच्च निम्न कैंडल गठन देखा गया जो एक सकारात्मक संकेत है। डाउन ट्रेंड अभी भी बरकरार है। सापेक्ष शक्ति सूचकांक 50 से नीचे बना है जो कमजोरी का संकेत है। मेरे कहने का मतलब यह है कि निर्णायक सकारात्मक ताकत देखने के लिए चार्ट पर जो मानदंड देखे जाने चाहिए, वे अभी तक नहीं देखे गए हैं। इसलिए व्यापारियों को 23678 से ऊपर दैनिक क्लोज प्राप्त होने तक शॉर्ट साइड पर ट्रेडिंग पूर्वाग्रह बनाए रखना चाहिए और एक बार दैनिक क्लोज पर यह स्तर प्राप्त हो जाने के बाद, अगले सप्ताह नीचे दिए गए स्तरों पर दोनों तरफ ट्रेड करने के अवसरों का पालन करना चाहिए।
संबंधित प्रतिरोध और समर्थन स्तर इस प्रकार हैं:
समर्थन – 23614, 23495, 23391
प्रतिरोध – 23678, 23856, 24314
भावना – तटस्थ
रुझान – नीचे
ट्रेडिंग पूर्वाग्रह – शॉर्ट साइड – सशर्त
बैंक निफ्टी आउटलुक और ट्रेड संभावना
बैंक निफ्टी ने इस सप्ताह 1.18% और 585 अंकों की बढ़त देखी। हालाँकि बैंक निफ्टी का साप्ताहिक चार्ट कोई ट्रेंड फॉर्मेशन नहीं दिखा रहा है, लेकिन इस सप्ताह की कैंडल्स ने अच्छे लाभ के साथ उच्च ऊँचाई और उच्च निम्न का निर्माण किया है जो एक सकारात्मक संकेत है। सापेक्ष शक्ति सूचकांक 50 पर स्थित है जो बैंक निफ्टी की शक्ति प्राप्त करने की प्रक्रिया को इंगित करता है या दूसरे शब्दों में, यह आरएसआई के मेक या ब्रेक पॉइंट पर खड़ा है। पहली बाधा बैंक निफ्टी के सामने 20 WEMA के रूप में दिखाई दे रही है, जहाँ से इस सप्ताह भी इसे बिक्री के दबाव का सामना करना पड़ा। किसी निर्णायक प्रवृत्ति के अभाव में, ट्रेडिंग पूर्वाग्रह नीचे दिए गए स्तरों के आसपास दोनों तरफ ट्रेड लेना है।
संबंधित प्रतिरोध और समर्थन स्तर इस प्रकार हैं:
समर्थन – 49777, 49276-183, 47706
प्रतिरोध – 50810, 51286, 51904
भावना – सकारात्मक
प्रवृत्ति – तटस्थ
ट्रेडिंग पूर्वाग्रह – दोनों तरफ
सप्ताह का स्टॉक (लॉन्ग/शॉर्ट)
लॉन्ग साइड ट्रेड: इस सप्ताह GLANMARK हमारे सेटअप में आ रहा है जहाँ हम लॉन्ग साइड ट्रेड शुरू करेंगे। लेवल और चार्ट इमेज कैश लेवल से है और अगर पोजीशन FnO में बनाई जा रही है तो इसे फ्यूचर लेवल में बदलने की जरूरत है। अगर यह FnO में उपलब्ध नहीं है तो ट्रेड को केवल स्पॉट लेवल में ही माना जाएगा।
CMP/1540.00 पर खरीदें, स्टॉप लॉस 1482.00 पर, टारगेट 1653.00 पर और रिस्क रिवॉर्ड रेशियो 1:2 है।
शॉर्ट साइड ट्रेड: इस सप्ताह NLCINDIA हमारे सेटअप में आ रहा है, जहां हम शॉर्ट साइड ट्रेड शुरू करेंगे। लेवल और चार्ट इमेज कैश लेवल से है और इसे फ्यूचर लेवल में बदलने की जरूरत है।
CMP/216.00 पर बेचें, स्टॉप लॉस 224.00 पर, टारगेट 200.00 पर और रिस्क रिवॉर्ड रेशियो 1:2.04 है।
वैकल्पिक निवेश
सोने का आउटलुक और ट्रेड संभावना – सोने में तेजी जारी है। विश्व इक्विटी और मुद्रा बाजारों में अनिश्चितताओं के कारण सोने को बढ़ावा मिल रहा है। इस सप्ताह सोने ने 2.24% की बढ़त के साथ नए रिकॉर्ड बनाए। हमें सोने में तब तक रुझान का अनुसरण करना चाहिए जब तक कि इसमें कोई उलटफेर के संकेत न दिखें और साप्ताहिक चार्ट पर अभी तक ऐसे कोई संकेत दिखाई नहीं दे रहे हैं। अगले सप्ताह भी सोने में लॉन्ग साइड पर ट्रेडिंग पूर्वाग्रह के साथ ट्रेड करना होगा। नीचे दिए गए स्तरों के आसपास जब भी अवसर मिले, सोने में लॉन्ग जाने की रणनीति अगले सप्ताह भी लाभदायक रह सकती है।
संबंधित प्रतिरोध और समर्थन स्तर इस प्रकार हैं:
समर्थन – $2796, $2774, $2748
प्रतिरोध – $2890, $2937
भावना – सकारात्मक
रुझान – तेजी
ट्रेडिंग पूर्वाग्रह – लॉन्ग साइड
चांदी का आउटलुक और ट्रेड संभावना – चांदी में भी धीरे-धीरे तेजी देखने को मिल रही है। हालांकि, इसमें थोड़ी अधिक अस्थिरता है। इस सप्ताह चांदी 1.51% की बढ़त के साथ बंद हुई और चार्ट पर एक अच्छा राउंडिंग बॉटम फॉर्मेशन बनता हुआ दिखाई दे रहा है। अगले सप्ताह चांदी को लॉन्ग साइड बायस के साथ ट्रेड किया जाना चाहिए। जब भी नीचे दिए गए स्तरों के पास कोई अवसर हो, तो लॉन्ग साइड ट्रेड लेने की रणनीति कारगर साबित हो सकती है।
संबंधित प्रतिरोध और समर्थन स्तर इस प्रकार हैं:
समर्थन – $31.32, $30.68, $29.89, $29.20
प्रतिरोध – $32.69, $33.79, $34.87
भावना – सकारात्मक
रुझान – तेजी
ट्रेडिंग बायस – लॉन्ग साइड
कच्चे तेल (WTI) का आउटलुक और ट्रेड संभावना – कच्चे तेल ने उम्मीद के मुताबिक कमजोरी दिखाई और सप्ताह को -3.78% की बड़ी कमजोरी के साथ बंद किया। कच्चे तेल ने साप्ताहिक चार्ट पर अपना महत्वपूर्ण समर्थन तोड़ दिया और पुराने डाउनट्रेंड क्षेत्र में प्रवेश किया, जो आने वाले सप्ताह में इसके खिलाफ प्रतिरोध का काम करेगा। साप्ताहिक चार्ट पर RSI स्तर 50 से नीचे आ गए हैं और अब कच्चे तेल के $66.47 के प्रमुख समर्थन तक पहुँचने की संभावनाएँ बढ़ गई हैं।
अगले सप्ताह ट्रेडिंग रणनीति शॉर्ट साइड पर ही होनी चाहिए। नीचे दिए गए स्तरों के आस-पास जब भी अवसर उपलब्ध हो, कच्चे तेल को शॉर्ट करने के अवसर तलाशने चाहिए।
संबंधित प्रतिरोध और समर्थन स्तर इस प्रकार हैं:
समर्थन – $70.60, $66.47
प्रतिरोध – $72.79, $75.09, $76.84
भावना – कमज़ोर
ट्रेंड–डाउन
ट्रेडिंग पूर्वाग्रह – शॉर्ट साइड
बिटकॉइन आउटलुक और ट्रेड संभावना – इस सप्ताह बिटकॉइन में भारी उतार-चढ़ाव दिखा। जिसके कारण क्रिप्टोकरेंसी का व्यापार करने वाले लोगों को भारी नुकसान उठाना पड़ सकता है या फिर भारी मुनाफा भी हो सकता है। क्योंकि ऐसी परिस्थितियों में शॉर्ट टर्म ट्रेडिंग के दृष्टिकोण से कोई भी सेटअप बनाना बहुत मुश्किल होता है। इसकी अस्थिरता आपके सेटअप को दोनों तरफ से तोड़ने की क्षमता रखती है, जैसा कि हमने इस सप्ताह देखा। लेकिन इसका एक सकारात्मक दृष्टिकोण यह भी है कि यदि आप बड़े समय क्षितिज को देखते हैं और साप्ताहिक और मासिक चार्ट पर स्तरों का अनुसरण करके अपने वित्तीय पोर्टफोलियो में बिटकॉइन को 5 से 10% आवंटन देने के लिए तैयार हैं, तो ऐसा करने से आपके पोर्टफोलियो को अतिरिक्त बढ़त भी मिलती है। जैसा कि इस बार भी देखा गया है, स्तरों के आसपास संचय ने बिटकॉइन की औसत खरीद लागत में सुधार किया होगा और आपके पोर्टफोलियो को मजबूत किया होगा।
इस सप्ताह बिटकॉइन में -1.26% की साप्ताहिक गिरावट दर्ज की गई और अनिश्चित मोमबत्ती गठन देते हुए स्तरों से ऊपर कारोबार करते हुए देखा गया। बिटकॉइन पिछले 2 महीनों से समेकन चरण में है। यदि आपके पोर्टफोलियो में बिटकॉइन का आवश्यक आवंटन अभी भी बना हुआ है, तो जब भी यह समेकन बैंड के निचले स्तरों पर आए, इसे खरीद लें और अपने जीवन के उच्चतम स्तर से ऊपर ब्रेकआउट की प्रतीक्षा करें।
संबंधित प्रतिरोध और समर्थन स्तर इस प्रकार हैं:
समर्थन – $93336, $91467, $89064
प्रतिरोध – $102948, $104454, $112026
भावना – सकारात्मक
प्रवृत्ति – समेकन चरण
ट्रेडिंग पूर्वाग्रह – दीर्घकालिक पोर्टफोलियो के लिए संचय
निष्कर्ष और अस्वीकरण MarkShala.com पर सामग्री केवल शैक्षिक और सूचनात्मक उद्देश्यों के लिए है। हम वित्तीय नियोजन, निवेश रणनीतियों, आर्थिक रुझानों और संबंधित विषयों पर ब्लॉग लिखने में माहिर हैं। जबकि हम सटीक और विश्वसनीय जानकारी प्रदान करने का प्रयास करते हैं, सामग्री को पेशेवर वित्तीय, निवेश या कानूनी सलाह के रूप में नहीं लिया जाना चाहिए।
***********
|| ॐ नमः शिवाय ||