
Hello MarketShalians, wish you all a very Happy and Prosperous New Year! As an Indian Stock Market Participant, I can say that the beginning of the year is good. The hope is that the whole year ahead should be spent on good deeds for the Wealth Warriors. Because the truth is that STOCK MARKET, GOLD, SILVER, BITCOIN and HUMANS always go up at the end. It is necessary to have only one skill and that is patience to achieve those highs. And the MARKETSHALIANS (who follow the MARKETSHALA) have no shortage of that skill, I believe. So let’s start the past week and in the coming week financial markets dissection.
Table of Contents
US Markets
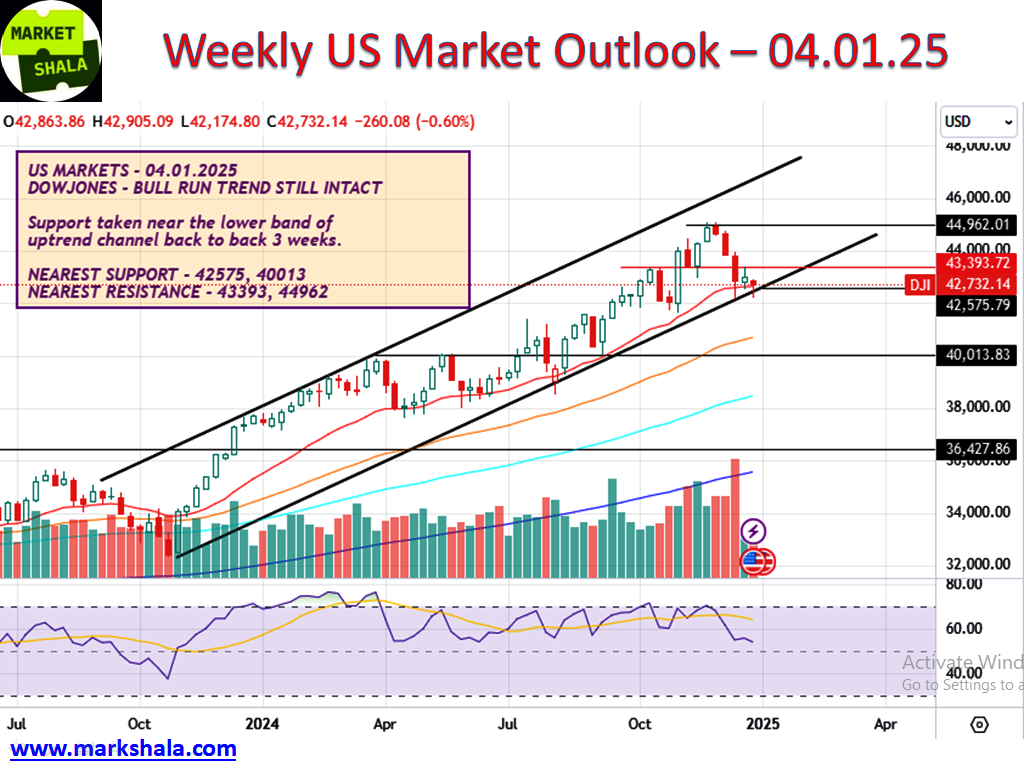
Dowjones is an index which gives direction not only to the US but to the whole world. No one should have any doubt that worldwide trend setup can be ascertained from here. This week a downfall of 260 points was witnessed in Dowjones. But when you carefully observe the candle formation of this week on the chart, you will find that Dowjones is seen showing a resilience approach. This very important index also respected the lower band support this week and closed above it which is a positive sign. Dowjones is taking a strong support above 20 WEMA.
In the coming week we may see an upward movement also from the current levels. If current levels close below 42575 then a big fall can also occur from there. It’s a make or breaks level and based on the kind of price and action we have seen this week, we are carrying a biased sentiment of upward side movement for the next week.
Next week support levels – 42575, 40013
Next week resistance levels – 43393, 44962
Next week sentiment bias – Positive
India Market
Nifty Outlook and Trade Probability
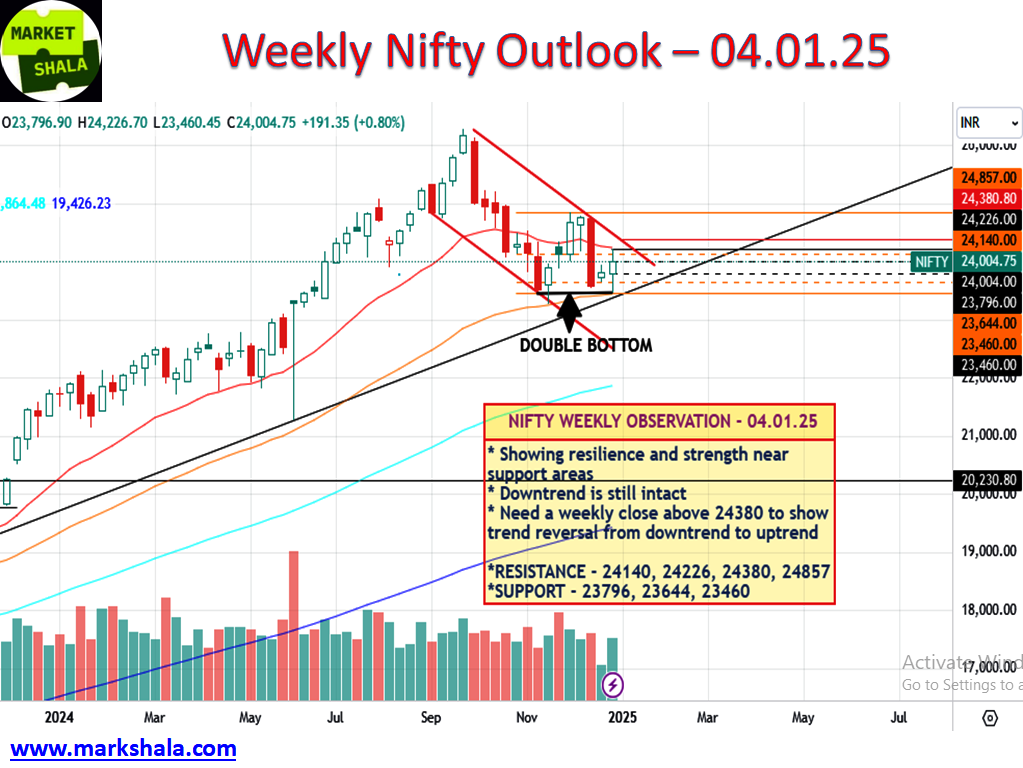
Nifty managed to stay in the green zone last week as well and closed with gains of 191 points. After continuous falls, even a little recovery looks very beautiful.
When you look at the price and action of the weekly chart, a double bottom formation is seen forming, which can also prove to be a positive sign of bottom formation. Nifty is seen taking support between 23400 – 700 for 3 consecutive weeks. If we talk about weekly moving averages then 20 WEMA has acted as a resistance, if nifty crosses 20 WEMA once and closes above it then its price and action will get strength.
For trend reversal, Nifty will have to close above 24380 so that the downtrend channel formed on the daily chart gets broken and a new bullish trend starts. Till this happens one should avoid getting over exited and going positional long in Nifty because the downtrend is still intact on the daily chart. The trading sentiment of Nifty for the coming week is looking neutral where opportunities for trades should be looked for on both sides. The respective levels are as follows.
Support – 23796, 23644, 23460
Resistance – 24140, 24226, 24380, 24857
Bank Nifty Outlook and Trade Probability
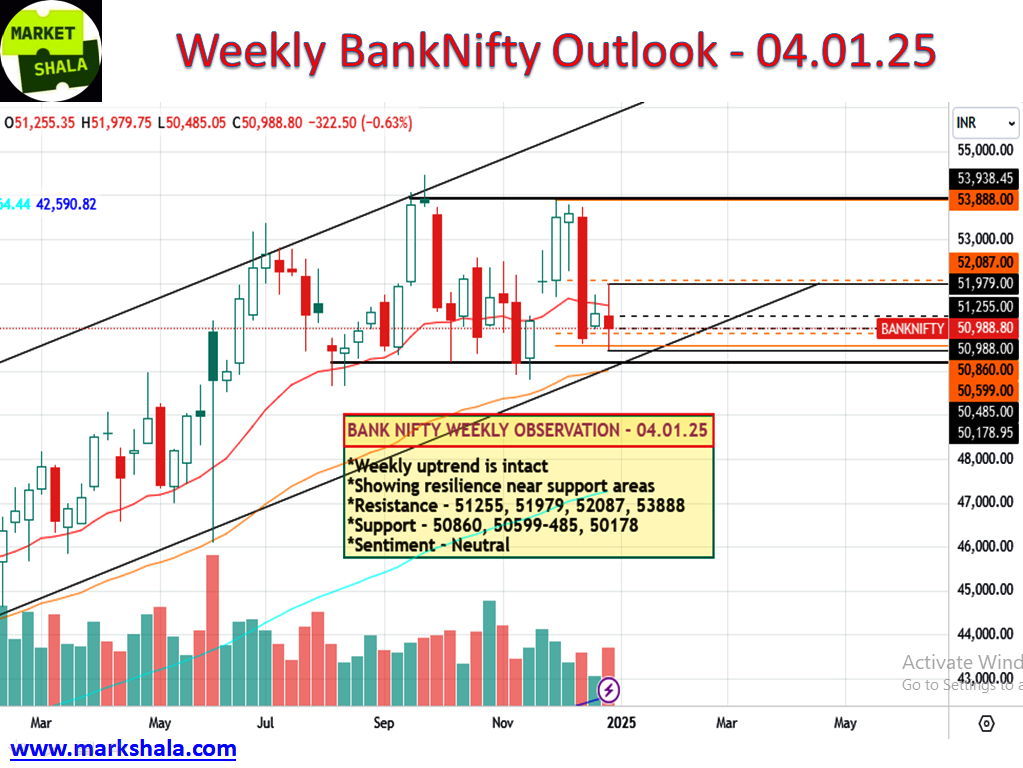
BankNifty traded in a large range last week and lost 322 points in the end. If you look at the main body formation of the last week candle on the weekly chart, you will find that BankNifty is showing resilience within a small range. The weekly uptrend of BankNifty is still intact. To trade in this, one should explore opportunities on both sides as price and action are still showing direction less on the charts. Day to day basis volatility is good for the traders due to which traders are getting opportunities to trade on both sides.
Therefore, traders should look for opportunities to trade on both sides around the support and resistance levels in the coming week. BankNifty has a strong range of 50178 to 53938 between which BankNifty has been moving for the last several months. In this range both sides look for opportunities to trade until one of the sides breaks decisively.
Related levels are as follows –
Support levels – 50860, 50599-485, 50178
Resistance levels – 51255, 51979, 52087, 53888
Stock of the week (Long/Short)
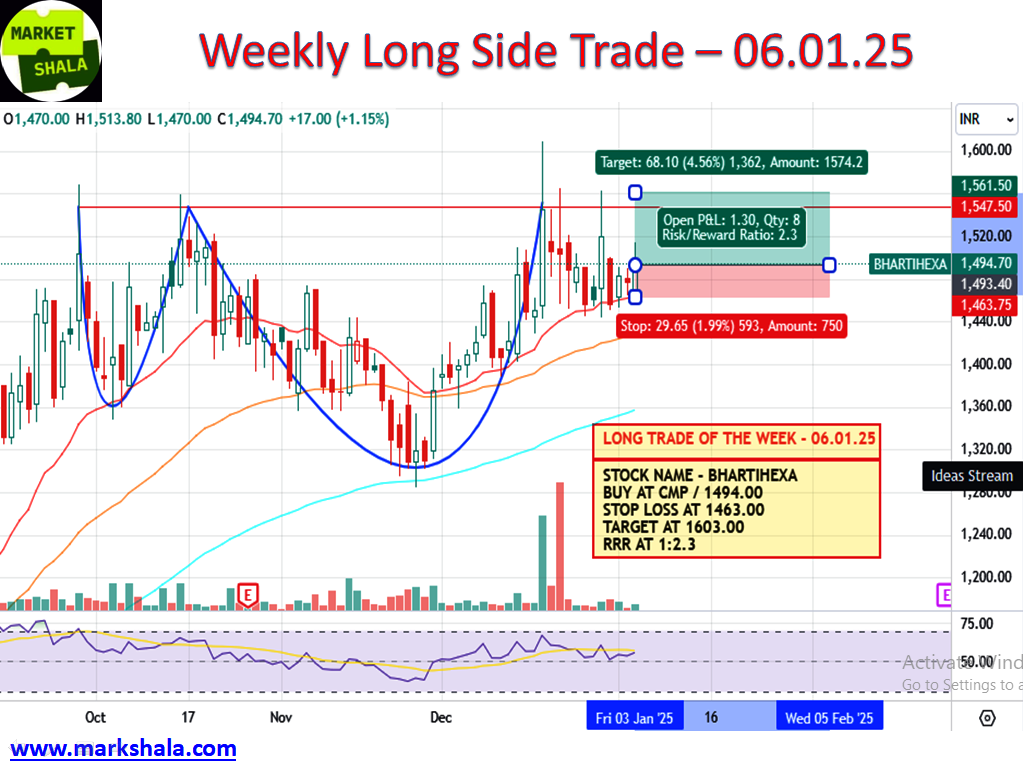
Long Side Trade:
This week BhartiHexa is coming in our setup where we will initiate the LONG side trade. Levels and Chart image is from the cash levels and it needs to be converted into the future levels if the position is being made in FnO. And if it is not in FnO then trade will be considered in the spot levels.
Buy at the CMP /1494.00, Stop Loss at 1463.00, Target at 1603.00 with a Risk Reward Ratio of 1:2.3
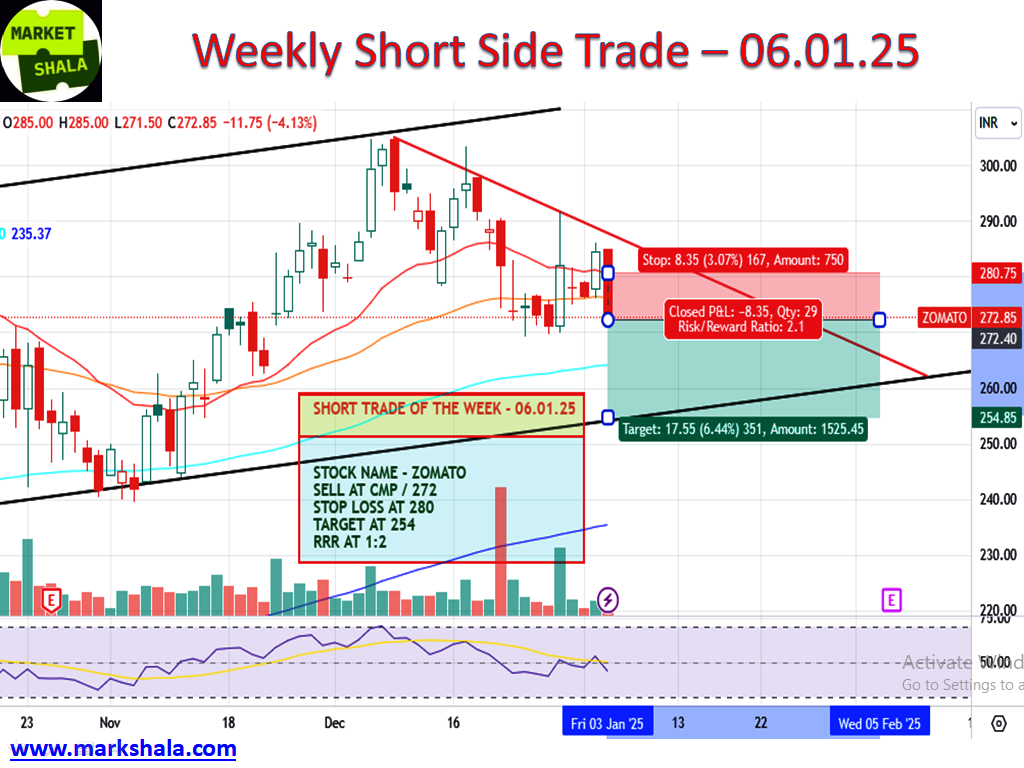
Short Side Trade:
This week ZOMATO is coming in our setup where we will initiate the SHORT side trade. Levels and Chart image is from the cash levels and it needs to be converted into the future levels.
Sell at the CMP /272.00, Stop Loss at 280.00, Target at 254.00 with a Risk Reward Ratio of 1:2
Alternative Investments
Gold Outlook and Trade Probability
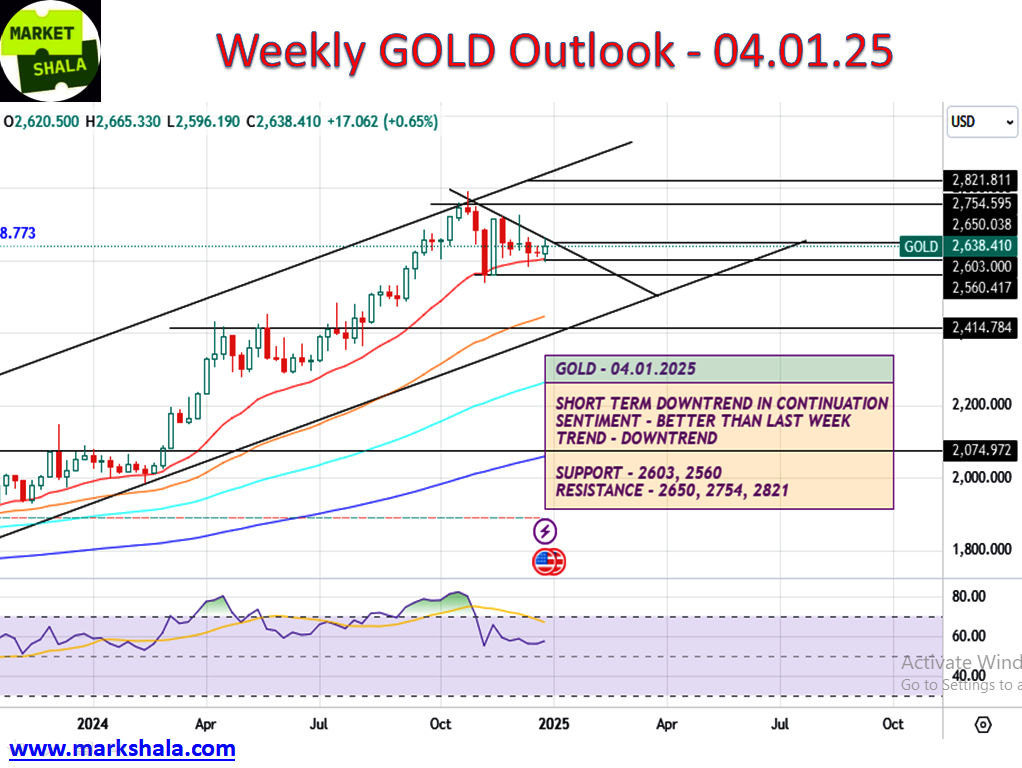
This week brought gains of 1.15 percent for gold. Despite these gains, gold has still not been able to break its short term downtrend. But its performance this week has been better than the previous week. A base formation seems to be taking place on the weekly chart, which is a positive sign. But if the trend is to reverse, we will wait for gold’s daily and then weekly close above $2650. The trade sentiment bias on gold will be on the positive side as this week gold has decisively closed above 20 WEMA. This sentiment will become even stronger after the close above $2650.
The trading strategy for the coming week is to trade on both sides until the level of $2650 is crossed as mentioned above.
Related levels are as follows.
Support – 2603, 2560
Resistance – 2650, 2754, 2821
Silver Outlook and Trade Probability
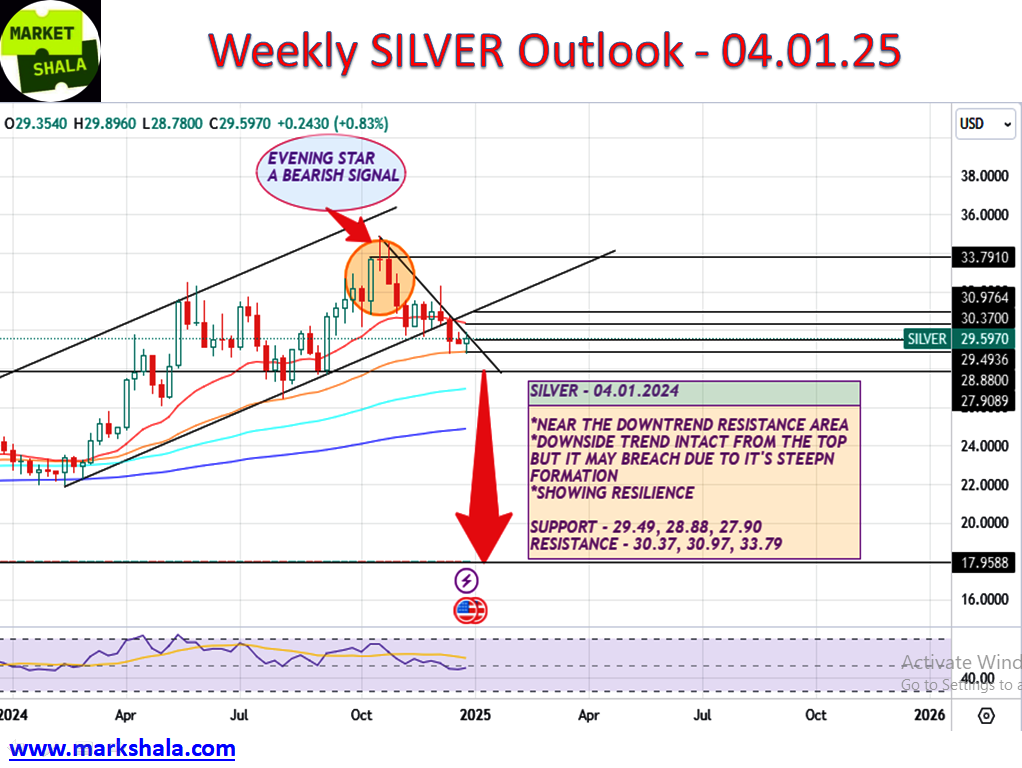
Silver also had a week of gains where gains of 0.83 percent were seen on a weekly basis. Although a steep downward trend line has formed resistance, we do not think it will be able to stop Silver next week due to its formation, it seems a bit difficult.
Silver is fanned between 20 and 50 WEMA and is showing resilience near the support areas. We will follow its trading strategy on both sides for next week and will trade both long and short from it near the prescribed levels.
Related levels are as follows.
Support – 29.49, 28.88, 27.90
Resistance – 30.37, 30.97, 33.79
Crude Oil (WTI) Outlook and Trade Probability
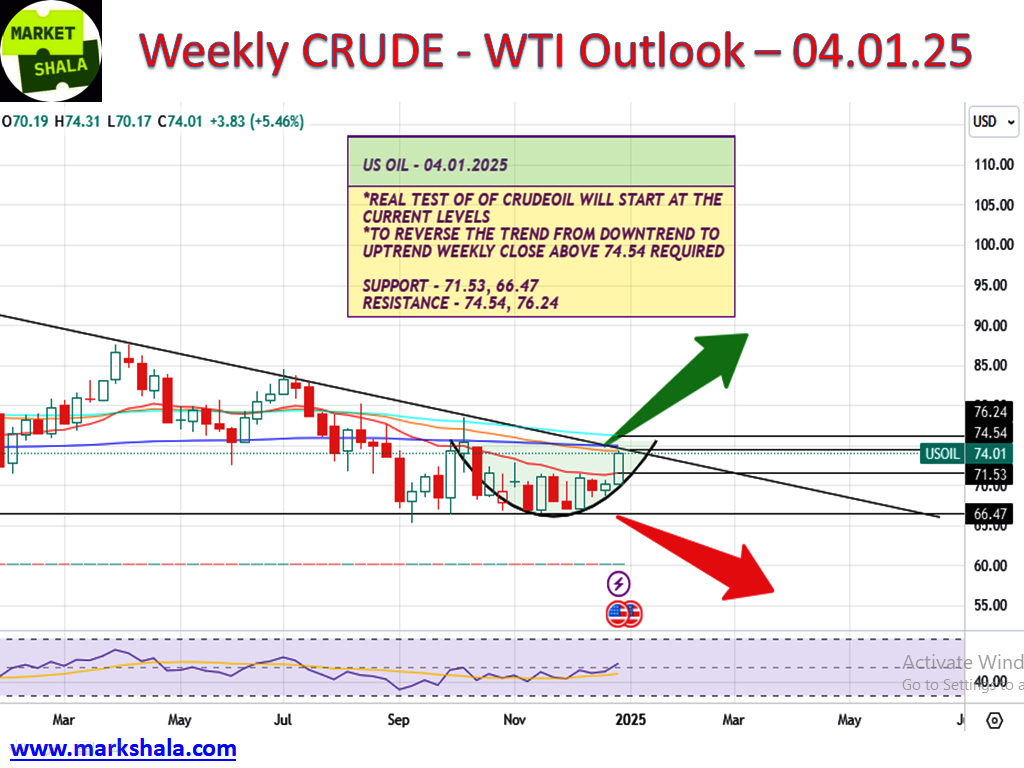
WTI Crude gave an excellent up-move last week by breaking the 20 WEMA resistance and showed gains of 5.46 percent. However, the downtrend pressure is still intact which is being supported by the strong resistances of 50,100 and 200 WEMA. But on the other hand, if you see the price and action on the weekly chart, here also a rounding bottom formation is seen forming which is a bullish formation.
Now the situation of Crude on the chart has become very interesting for the coming week, there is equal strength on both bullish and bearish sides. It remains to be seen whether WTI Crude is able to give a daily and then weekly close above $74.54 or once again Crude will have to move from here towards $66.47.
The strategy for trading Crude will have to be kept on both sides. At whatever levels it is now, we will short there with a strict stop loss and if Crude gives a close above $74.54 on the daily charts, then the trading bias will switch to the long side.
Related levels are like this.
Support – $71.53, $66.47
Resistance – $74.54, $76.24
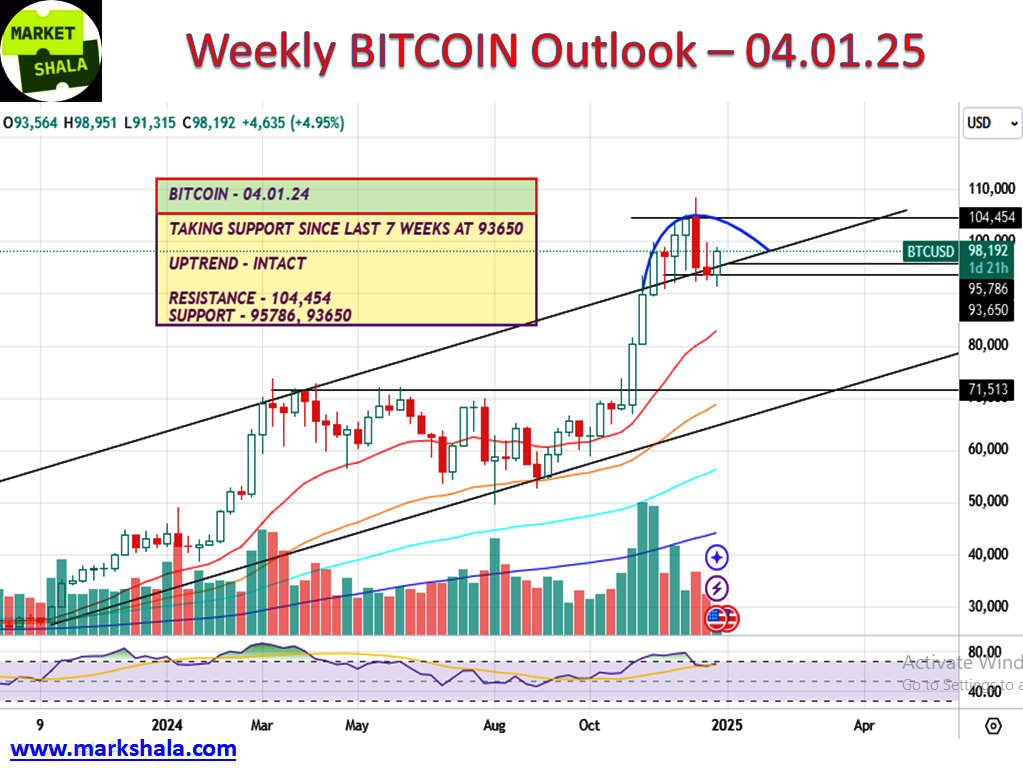
Bitcoin Outlook and Trade Probability
Last week Bitcoin showed a gain of 4.95% from its support areas. From here the uptrend looks intact and strong. Shorting Bitcoin should be avoided and it should accumulate near support areas. Near resistance levels profit can be booked but the kind of strength that is seen in its price and action, shorting Bitcoin at any level will not be free from risk.
Related levels are as follows.
Support – $95786, $93650Resistance – $104,454
Conclusion and disclaimer
The content on MarkShala.com is intended for educational and informational purposes only. We specialize in writing blogs on financial planning, investment strategies, economic trends, and related topics. While we strive to provide accurate and reliable information, the content should not be taken as professional financial, investment, or legal advice.
हिंदी अनुवाद
यहां क्लिक करें और हिंदी दर्शक इस विषय पर मेरा यूट्यूब वीडियो देख सकते हैं।
Thank you for tuning in to Market-Shala’s Fintalk Dose — your essential source for insights into the financial markets, India and global economy, Don’t forget to share this story on your network.
Explore More on MarketShala
Stay updated with insights on global events, market analysis, and investment strategies on Markshala, where we aim to make financial education accessible and actionable.
Now, let’s shift gears and unwind! Treat yourself to the soothing tunes of MuziMuffin with his latest release available on Spotify, YouTube, Apple Music and Amazon Music. Relax, recharge, and enjoy the vibe!
***********
|| ॐ नमः शिवाय ||