
Hello MarketShalians, Welcome to the world of MarketShala’s Weekly Stock Market Wrap: India and Global Trends. This is a miraculous world, friends, the more you understand it, the less it seems. One of my favorite thought is that stock market is such a fair in which if you get lost due to its volatility, then there is nothing you need to do, just stand in one place. Just like the parents find a child lost in a fair, this stock market will find you just like your parents and will give you a way to move ahead. And if you try to go further inside the market amidst the ups and downs of the market then believe me there are many such children who get lost in this market fair in such a way that they could never find it again. So what I mean to say is that increases your knowledge and uses that knowledge without any pride because there is only one scoundrel in this investing world and that is the market itself. I hope that you would have understood the meaning of my words.
US Bond yields continued to play a game this week which kept worldwide equity markets under pressure. But things appeared to be getting better towards the end of the week. European markets showed excellent growth, while the declaration of ceasefire between Israel and Hamas seemed to have eased the geopolitical issues and for India, rising crude rates seemed to be under some control.
Donald Trump’s swearing-in ceremony is near and the US as well as worldwide markets is awaiting clues after his coronation. Meanwhile, US economy data also gave a pleasant surprise, keeping alive the possibilities of fed rate cut in the coming months. Now let’s set up a segment wise micro check and understand what is hidden in this time’s Weekly Stock Market Wrap: India and Global Trends.
Table of Contents
US Markets
US markets witnessed a home comeback this week. All the main US indexes Dowjones, Nasdaq, S&P500 traded with pressure at the start of the week. But then US economy data turned the game around and all the main US indexes gave weekly close with 2-3 percent approximate gains.
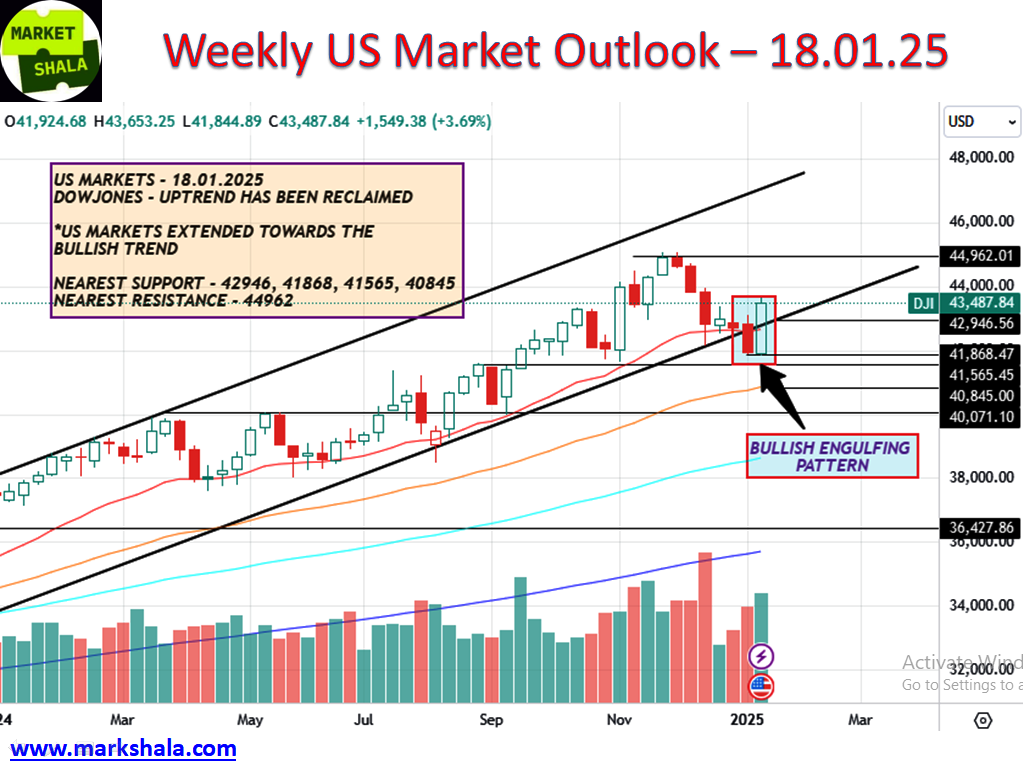
As you can see in the weekly chart of Dowjones, along with one big bullish candle, a two candle bullish formation is visible which in technical language we call BULLISH ENGULFING pattern. This is a positive sign which seems to strengthen the possibilities of US market remaining on the bullish side in the coming week. Also, you must have seen that Dow Jones has regained its big bullish trend. This indicates that the economic data i.e. inflation, unemployment, etc. that came last week are being taken seriously by the market participants on the positive side. The US markets seem fully prepared to welcome their new president Donald Trump. Now only the levels near lifetime highs remain in the form of resistance which is a good sign. After suffering 6 consecutive weeks of decline, Dowjones seems ready for a new bullish run.
Our readers who trade US markets should make trades and investment strategy next week with bullish sentiments. Support and resistance levels of trade and sentiment on Dowjones will be as follows.
Support – 42946, 41868, 41565, 40845
Resistance – 44962
Sentiment – Bullish
India Market
Nifty Outlook and Trade Probability
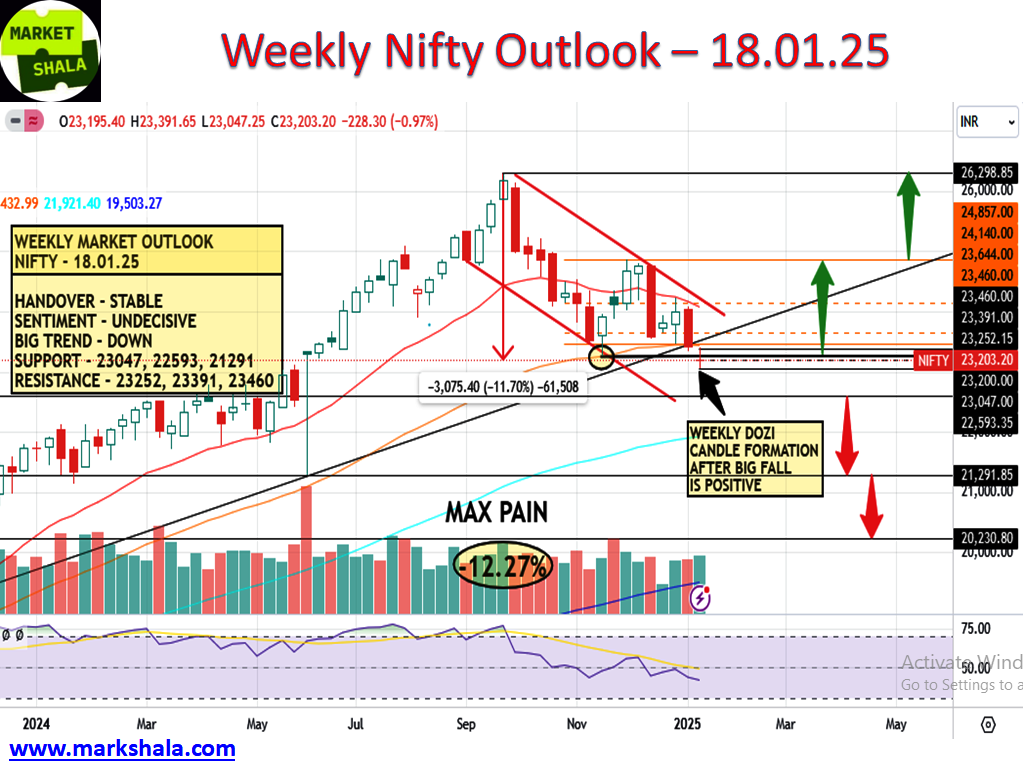
As for the possible double bottom zone that we talked about last week, however by the weekend Nifty somehow closed near those levels. But before doing so it definitely created a new low from its peak. Now the new low of Nifty which was earlier -11.8% has now become -12.27%. Nifty registered a weakness of 0.97% by falling 228 points. This performance of Nifty will be termed as poor in comparison to the global markets. Which shows that there is a weakness in Indian markets whose brunt is being borne by investors in the form of wealth destruction. Indian markets are seen underperforming the world markets.
Now let us say some positive things, as you can see in the weekly chart that Nifty has also shown resilience this week. We know the candle formation of this week as DOZI formation. Its meaning is the presence of markets in indecisive territory where neither the market is able to go neither up nor down. When this formation forms after a good drop, there is a chance of a reversal probability with a base formation. But this will require a confirmation bullish candle. So it will be interesting to watch the price and action next week.
Meanwhile, the support and resistance spot levels for traders will be as follows:
Support – 23047, 22593, 21291
Resistance – 23252, 23391, 23460
Sentiment – Neutral
Bank Nifty Outlook and Trade Probability
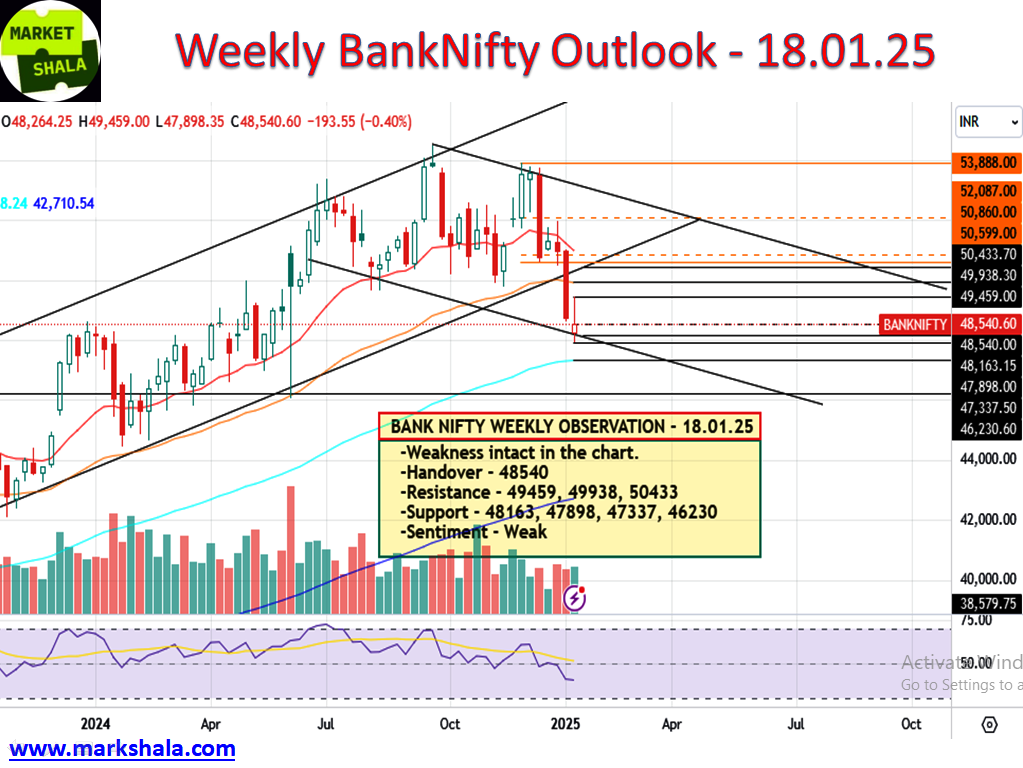
This week also a downtrend was seen forming on the charts of Bank Nifty. After breaking the lower band of the uptrend last week, this week too as per predictions Bank Nifty showed weakness and fell by 193 points to register a loss of -.40%. The sentiment for Bank Nifty is weak, so the trading bias should remain on the short-side for the next week as well. It will be more beneficial to trade with a short side bias on Bank Nifty whenever it comes near the given resistance levels or breaks the support levels.
Meanwhile the support and resistance spot levels for traders will be as follows:
Support – 48163, 47898, 47337, 46230
Resistance – 49459, 49938, 50433
Sentiment – Weak
Stock of the week (Long/Short)
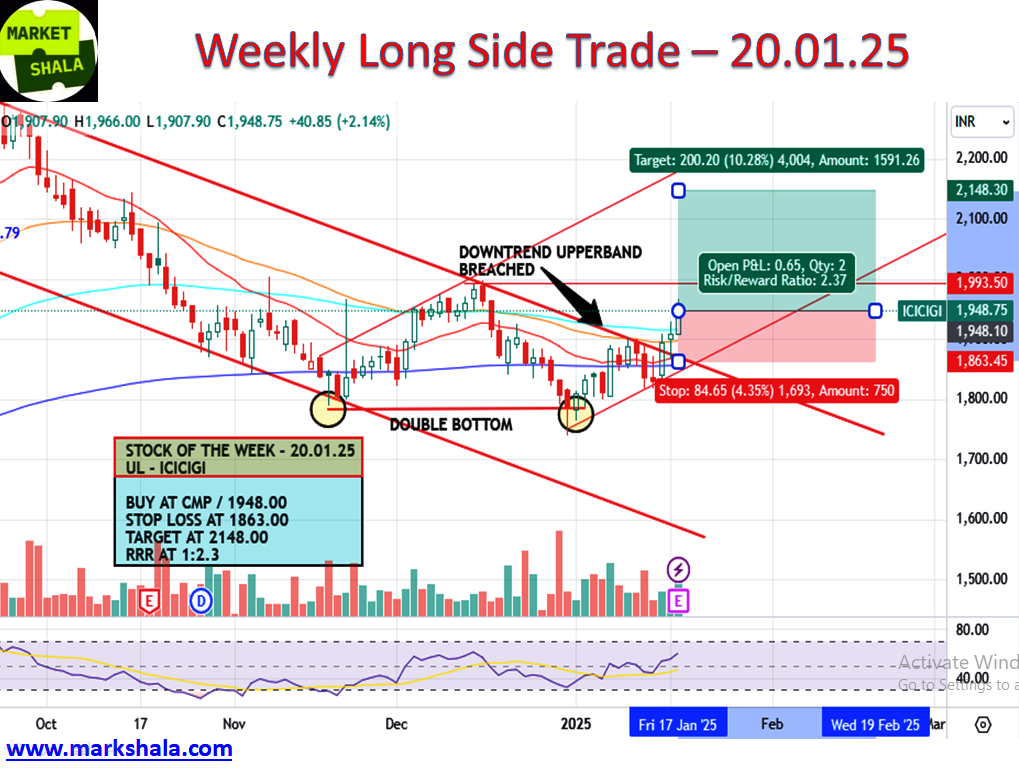
Long Side Trade: This week ICICIGI is coming in our setup where we will initiate the LONG side trade. Levels and Chart image is from the cash levels and it needs to be converted into the future levels if the position is being made in FnO. And if it is not available in FnO then trade will be considered in the spot levels only.
Buy at the CMP / 1948.00, Stop Loss at 1863.00, Target at 2148.00 with a Risk Reward Ratio of 1:2.3
Short Side Trade: This week we haven’t got any Short Side Stock Trade idea into our setup and as we always say when your setup is not giving you trade better you stay away from taking trade. Because not taking trade is also equivalent to take trade in the trading business.
Alternative Investments
Gold Outlook and Trade Probability
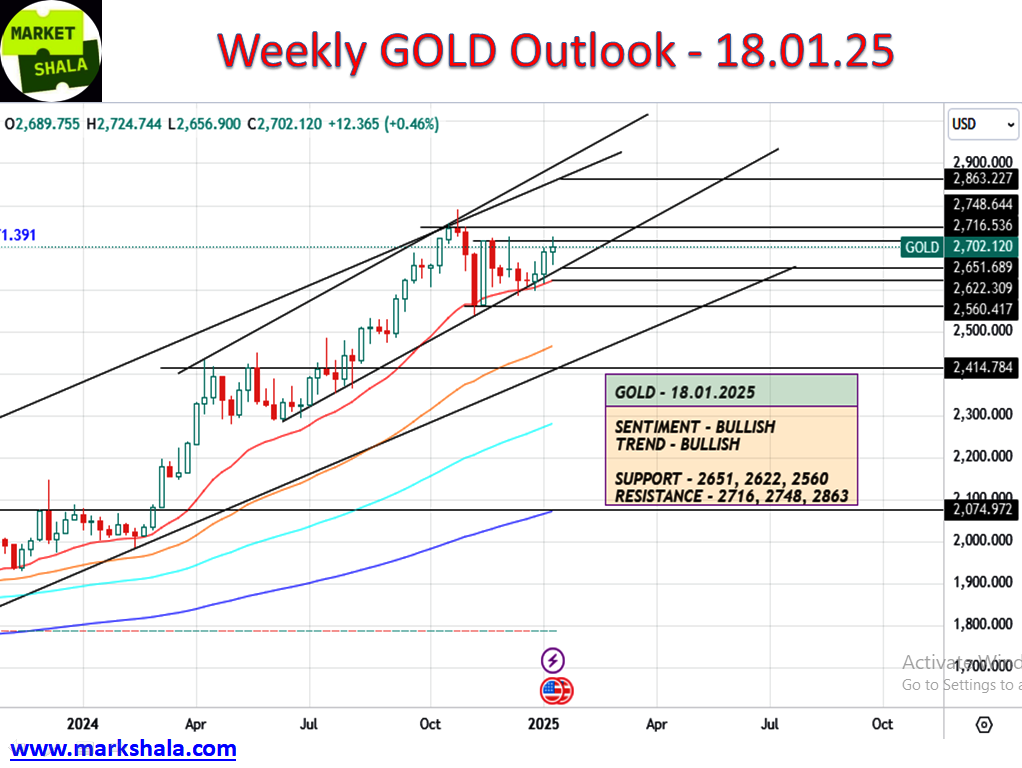
This week Gold continued the bullish momentum as we predicted last week it has registered gains of $12.36 with a gain of 0.46%. Bullish momentum is still continuing on the weekly charts and the trading sentiment remains bullish for the coming week as well. A new bullish trend channel has formed on the chart, which can provide further strength to the momentum of Gold in the coming week. There is only one resistance visible in front of Gold price now and that is the levels near its lifetime highs, which is also seen providing positivity to its chart.
Trading strategy, we will stay on the long side. We will buy Gold when it comes above the resistance area and near the support areas given below.
Support – $2651, $2622, $2560
Resistance – $2716, $2748, $2863
Sentiment – Bullish
Silver Outlook and Trade Probability
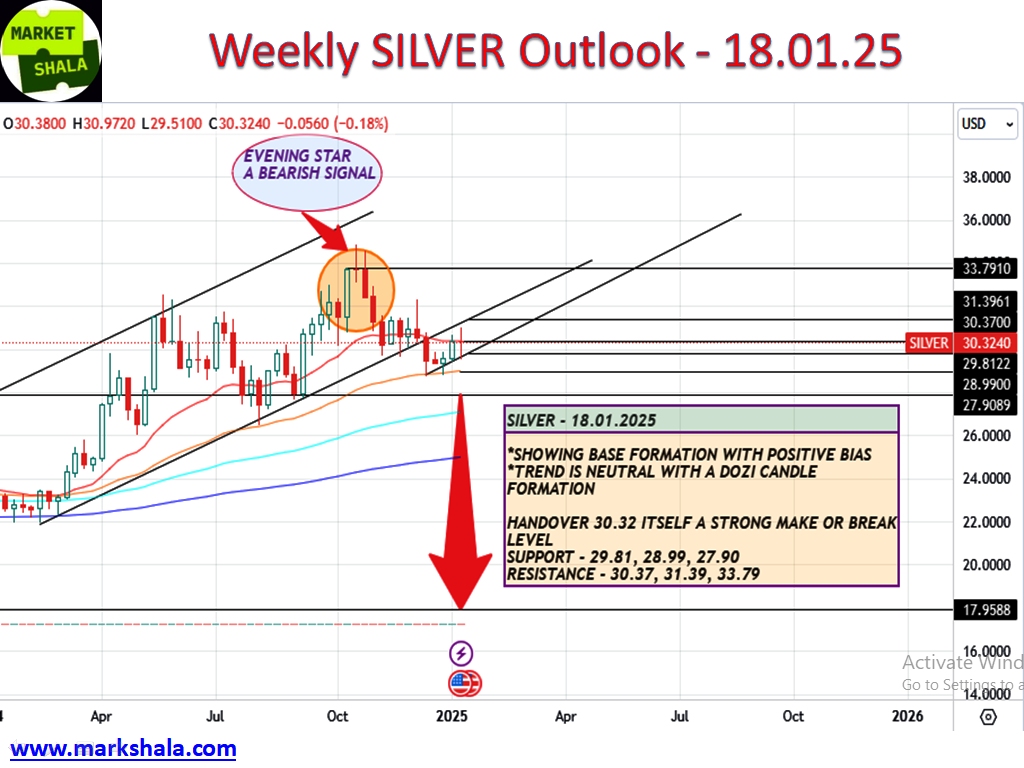
This week’s price and action of Silver is pushing silver towards an indecisive territory. A DOZI candle has formed on the weekly chart and that level is exactly on the 20 Weekly Exponential Moving Average. From here a make or break situation is developing for Silver. Silver is seen forming a considerable base formation but we do not see any conviction to decisively trade it on the long side yet.
Hence next week we will look for opportunities to trade Silver on both sides. We will short silver if it comes near resistance and if it consolidates near support then we will trade it on the long side as well. So in the coming week Silver will need a skilled both side trading approach. But one thing to keep in mind is that trade should be done with proper risk and reward and stop loss. And if any single side bias is felt while trading then it will be comparatively better to stay on the positive i.e. bullish side.
Support – $29.81, $28.99, $27.90
Resistance – $30.37, $31.39, $33.79
Sentiment – Neutral
Crude Oil (WTI) Outlook and Trade Probability
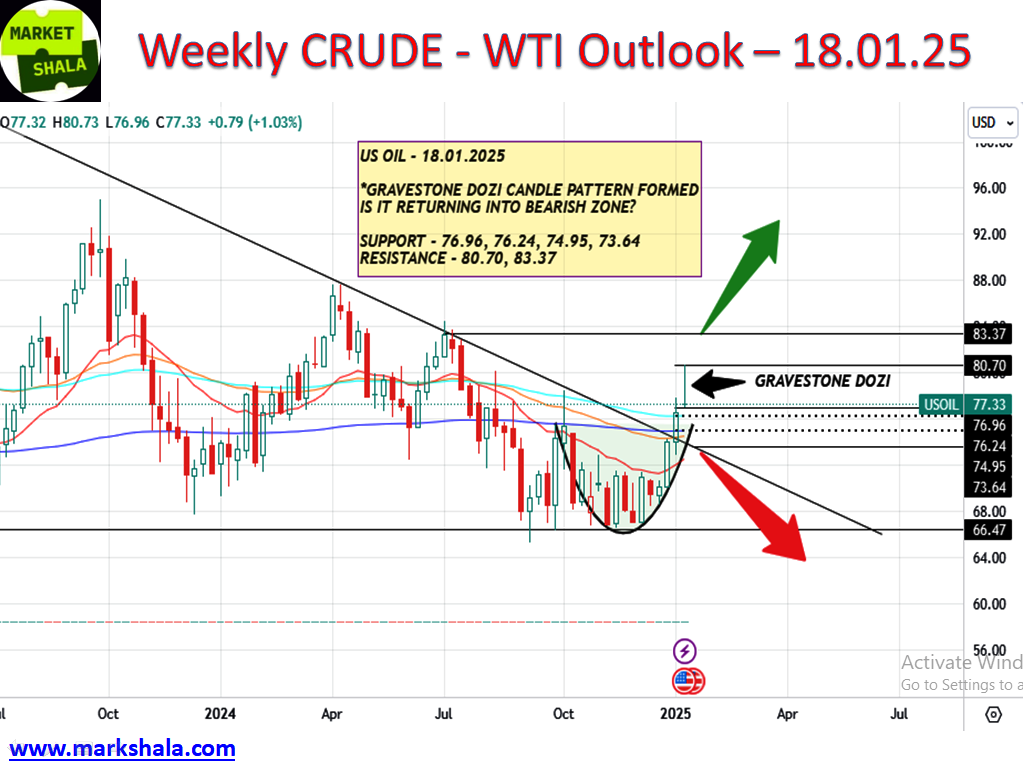
As we had predicted last week, crude provided a good opportunity for long side trades. But now looking at the candle formations seen on the weekly charts, we feel that it is time to be a little cautious. The candle formation is visible this week on the chart shows a GRAVESTONE DOZI. This formation seems to be creating a doubt whether crude is ready for a return journey from here. Last week’s geopolitical developments also played a role in this, i.e. a ceasefire was declared between Israel and Hamas. So now the question arises what should we traders do, long or short?
Although crude oil has still maintained its decisive support levels, we will follow a cautious approach for the next week and that will be to trade crude on both sides. We will definitely maintain positive bias but will look for opportunities to trade on both sides on below mentioned levels. We will short crude near resistance and take long trades near support.
Support – $76.96, $76.24, $74.95, $73.64
Resistance – $80.70, $83.37
Sentiment – Neutral
Bitcoin Outlook and Trade Probability
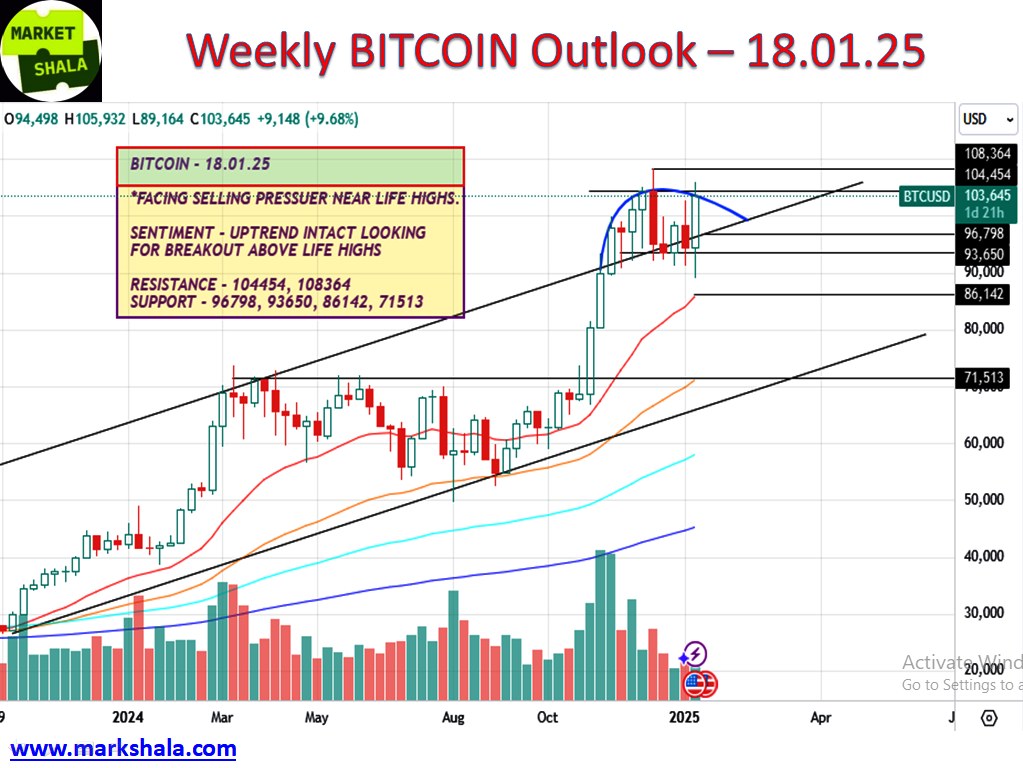
Bitcoin has shown excellent momentum from its support level near $93650 and while I am writing this blog, it is seen trading at $103403 level. There is nothing new to say about Bitcoin, one just should not make the mistake of shorting it and it should be gradually accumulated in your portfolio whenever it comes near the given support levels. In today’s time at least 5% of any investing portfolio should be in quality crypto currency.
Currently, Bitcoin is seen facing selling pressure near its lifetime highs. However, since the last one month, Bitcoin is seen absorbing the supply that is coming near the life high levels. I feel it’s a matter of time, once the daily and weekly close and breakout is received at its life highs, Bitcoin may start showing full possibility of reaching a new blue sky zone.
Entry and exit can be planned in the coming week by keeping the below given levels in mind and as I mentioned above and if there is a long-term investing horizon, then when Bitcoin comes near the support levels, then it should be accumulated only.
Support – $96798, $93650, $86142, $71513
Resistance – $104454, $108364
Sentiment – Bullish
Conclusion and disclaimer
The content on MarkShala.com is intended for educational and informational purposes only. We specialize in writing blogs on financial planning, investment strategies, economic trends, and related topics. While we strive to provide accurate and reliable information, the content should not be taken as professional financial, investment, or legal advice.
हिंदी अनुवाद
यहां क्लिक करें और हिंदी दर्शक इस विषय पर मेरा यूट्यूब वीडियो देख सकते हैं।
How did you like our blog? Do share your thoughts in the comment box. Your thoughts will inspire us to bring more good and relevant content for you so that we can enhance the quality of our content and you can benefit more.
Thank you for tuning in to MarketShala’s Fin Dose — your essential source for insights into the financial markets, India and global economy, Don’t forget to share this story on your network.
Explore More on MarketShala
Stay updated with insights on global events, market analysis, and investment strategies on Markshala, where we aim to make financial education accessible and actionable. Now, let’s shift gears and unwind! Treat yourself to the soothing tunes of MuziMuffin with his latest release available on Spotify, YouTube and Apple Music. Relax, recharge, and enjoy the vibe!
***********
|| ॐ नमः शिवाय ||