
Hello MarketShalians, Another tuff week has come to an end. It has been a long and difficult week for equity market participants. Be it worldwide markets or Indian markets, investors had to watch their portfolios getting devastated. On the one hand, the entire world is bit concerned about the newly elected US president Donald Trump’s ability to surprise anyone with some of his actions or the turbulent behavior of the US economy due to which the US bond yields are continuously falling to new highs. The chances of expected rate cuts by Federal bank also seem to be weakening. Due to all these uncertainties, US markets also showed profit booking across the week. And its impact was bound to have a negative impact on markets across the world. Meanwhile Indian markets also seemed to be facing its domestic worries. Q3 earning season has started and due to chances of results remaining weak in this quarter too and continued selling by FIIs, Indian markets also remained in the grip of tremendous profit booking this week. According to the market experts, the results of both the quarters Q3 and Q4 may remain under pressure due to which volatility is likely to remain in the Indian markets in the coming days. But these coming 5-6 months will also give you an opportunity to shop in quality stocks on good valuations. So let us see what the charts are predicting to understand the probability for the next week.
Table of Contents
US Markets
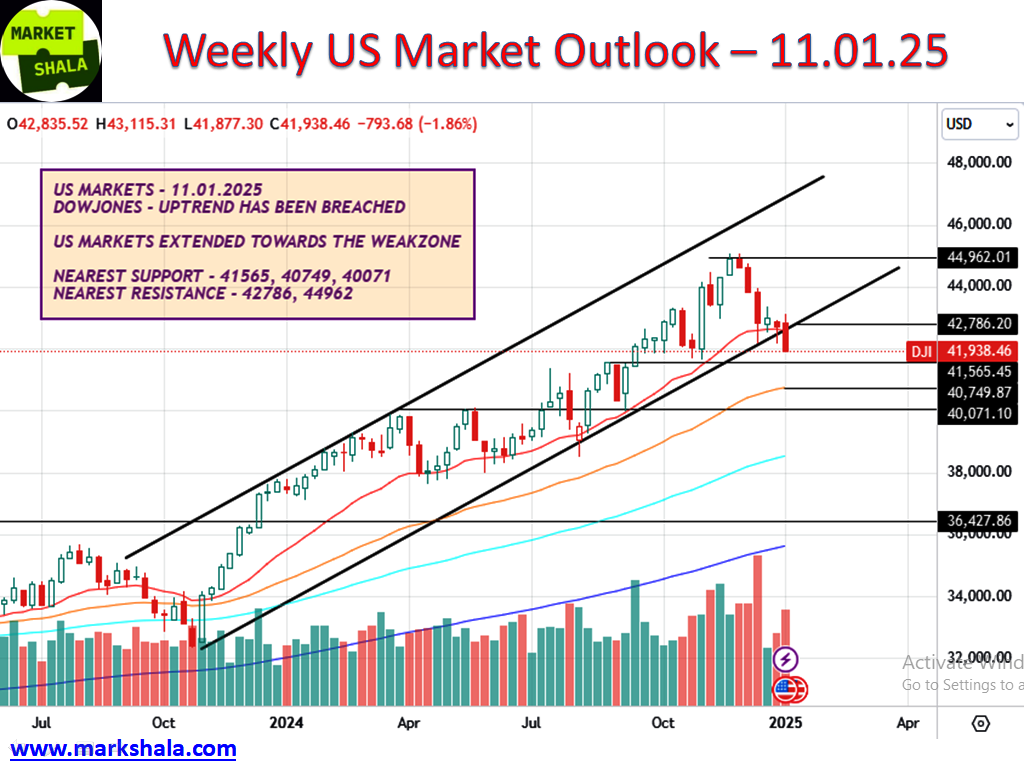
To understand the sentiments of the world markets, we refer to the DowJones index, which this week has breached its uptrend channel that it has been running since October’2023. Last week, DowJones was seen taking support at the lower band of this channel. At the beginning of the week, the lower band of the channel acted as a support in the trading circles, but by the end of the week, the lower band support failed to hold DowJones. This is a matter of concern, not only for the US markets but also for worldwide markets. US markets continued with full week of profit-booking due to the rise in the US bond yields. NASDAQ, S&P500, Dowjones all indexes witnessed a decline. Dowjones fell 793 points to suffer a loss of 1.86%. As you can see from the charts, the sentiment has turned weak. If Dowjones remains below this channel in the coming week, the weakness will increase further. Support and resistance areas will be the ones to observe for the coming week.
Support – 41565, 40749, 40071
Resistance – 42786, 44962
Next week sentiment bias – Weak
India Market
Nifty Outlook and Trade Probability
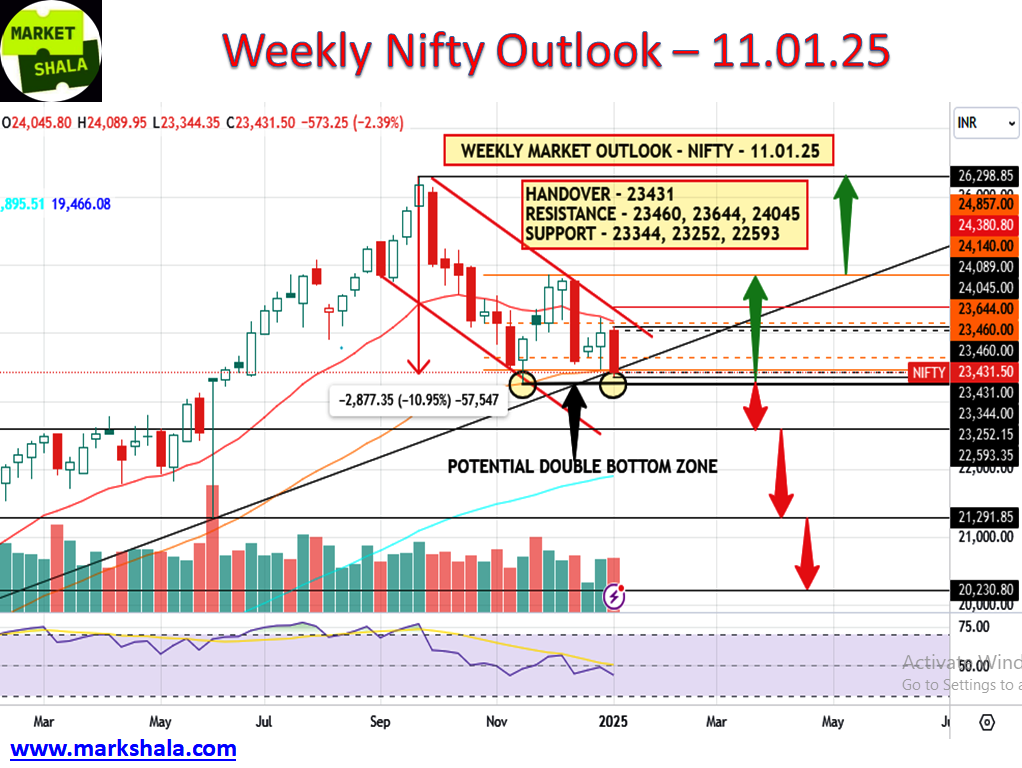
This week the main bench mark index of Indian market Nifty lost 573 points and closed down by 2.39%. If you look at the weekly chart, you will find that the current position of Nifty is near a probable double bottom zone. I am not saying that the bottom will be formed here or exactly at 23252. I am just saying that this is a strong zone. If Nifty does not stay here, then lower levels will be opened for it and then we can see Nifty going up to 22593 also. The downtrend of nifty is intact and short trades are getting benefit. The selling pressure will further increase whenever nifty breaches the given supports below. Till the time this channel does not give an upward breakout, which is still quite far, selling pressure will be generated as soon as it comes near every resistance level. This is the chart of spot level of nifty. Whoever trades the nifty index will have to convert the given levels with nifty future levels. The support and resistance levels of nifty for the coming week will be as follows.
Support – 23344, 23252, 22593
Resistance – 23460, 23644, 24045
Next week sentiment bias – Weak
Bank Nifty Outlook and Trade Probability
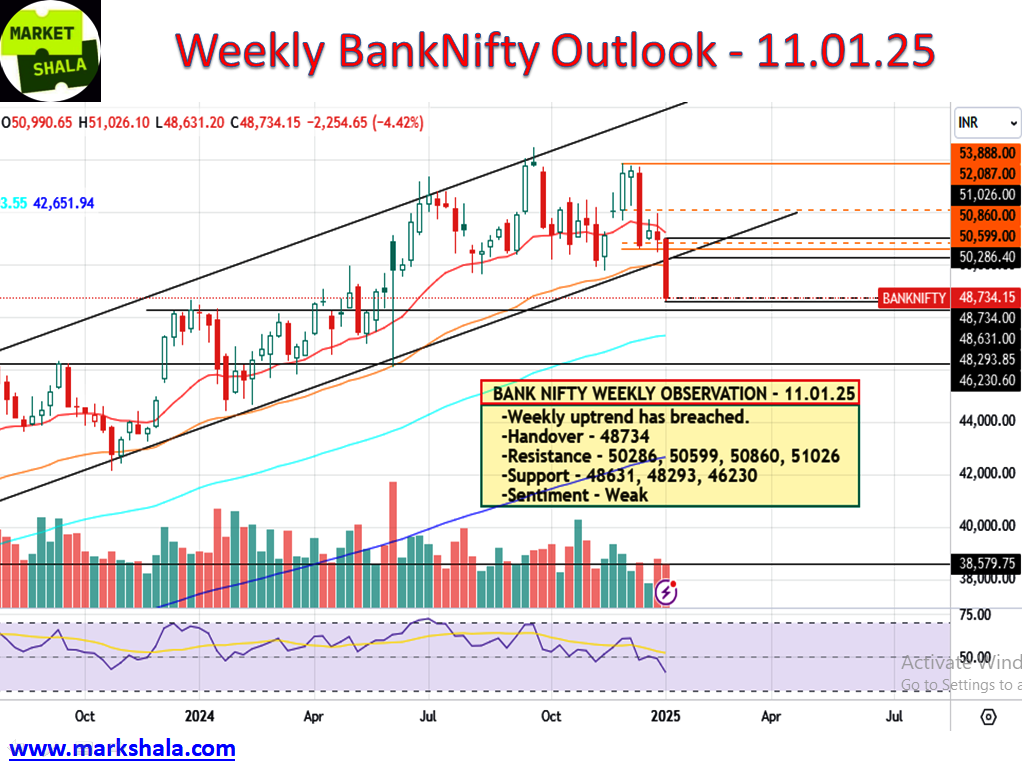
This week Bank Nifty did what this index is known for and that is extreme volatility. Bank Nifty closed with a fall of 4.42% or 2254 points. Bank Nifty which was looking much stable and stronger in comparison to the chart formation of Nifty till last week is giving a completely opposite indication this week. Bank Nifty has breached its uptrend channel and its sentiments are seen showing a severe weakness. Anyway, after the breach of channel support, the trading bias has inclined towards the short side. To trade bank nifty, one should follow the strategy of shorting when support is breached and when it comes near resistance levels in the coming week. Support and resistance levels at spot levels are as follows but they need to be converted into future levels before getting into the respective trades.
Support – 48631, 48293, 46230
Resistance – 50286, 50599, 50860, 51026
Next week sentiment bias – Weak
Stock of the week (Long/Short)
Long Side Trade
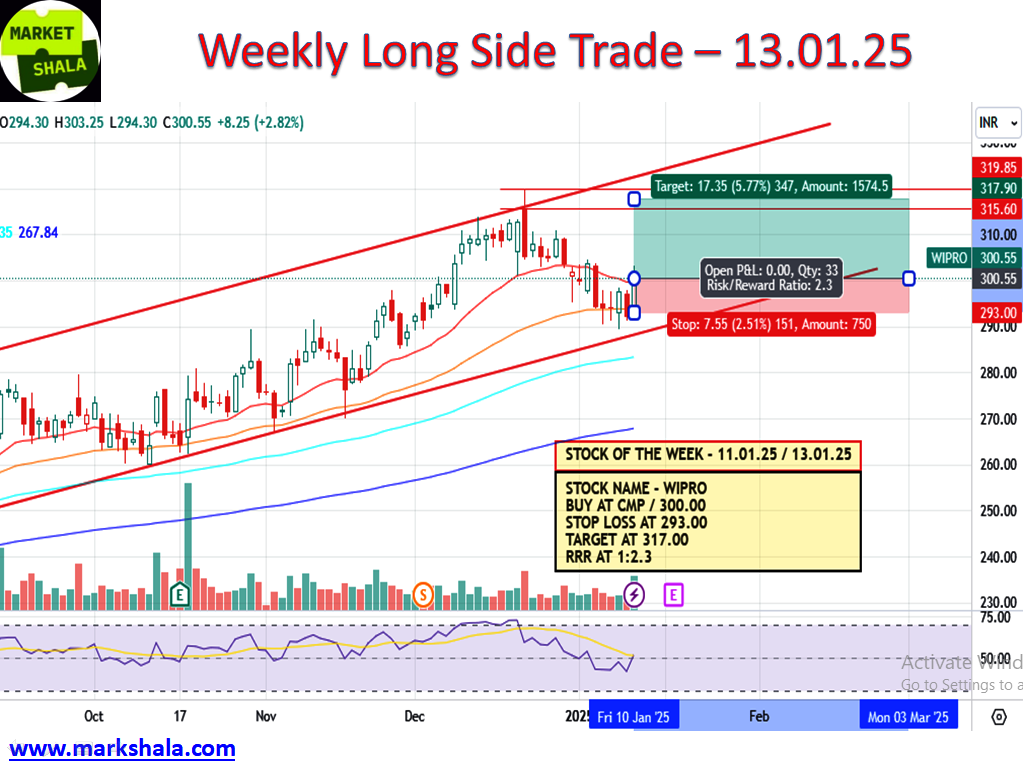
This week WIPRO is coming in our setup where we will initiate the LONG side trade. Levels and Chart image is from the cash levels and it needs to be converted into the future levels if the position is being made in FnO. And if it is not available in FnO then trade will be considered in the spot levels only.
Buy at the CMP / 300.00, Stop Loss at 293.00, Target at 317.00 with a Risk Reward Ratio of 1:2.3
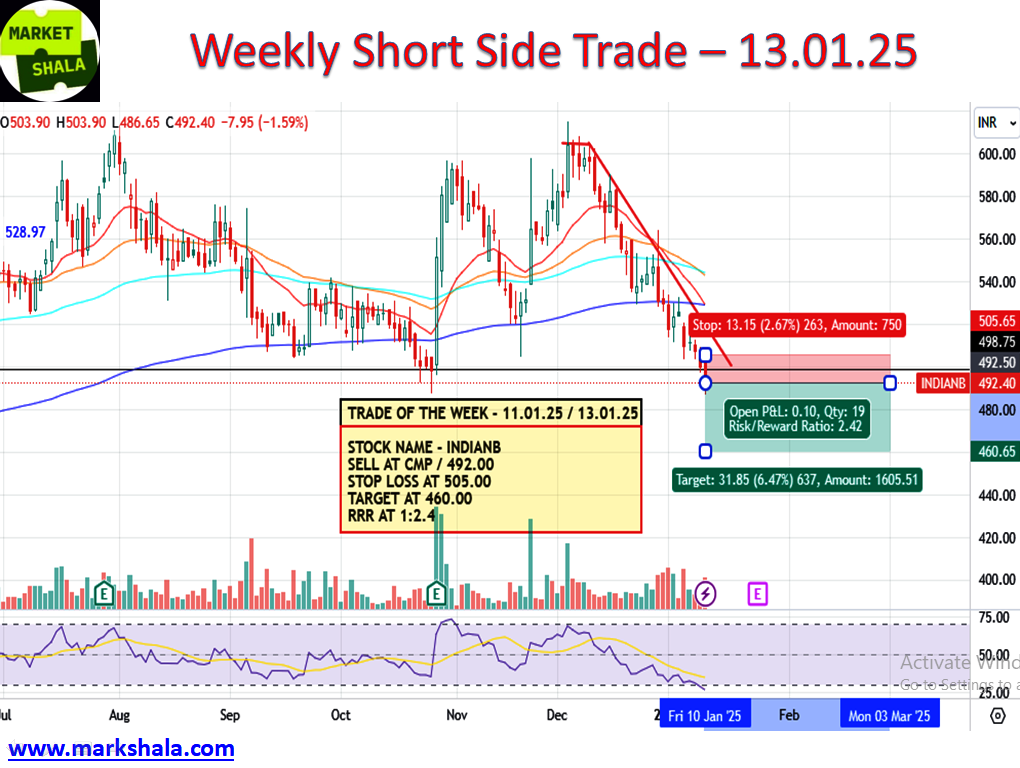
Short Side Trade
This week INDIANB is coming in our setup where we will initiate the SHORT side trade. Levels and Chart image is from the cash levels and it needs to be converted into the future levels.
Sell at the CMP / 492.00, Stop Loss at 505.00, Target at 460.00 with a Risk Reward Ratio of 1:2.4
Alternative Investments
Gold Outlook and Trade Probability
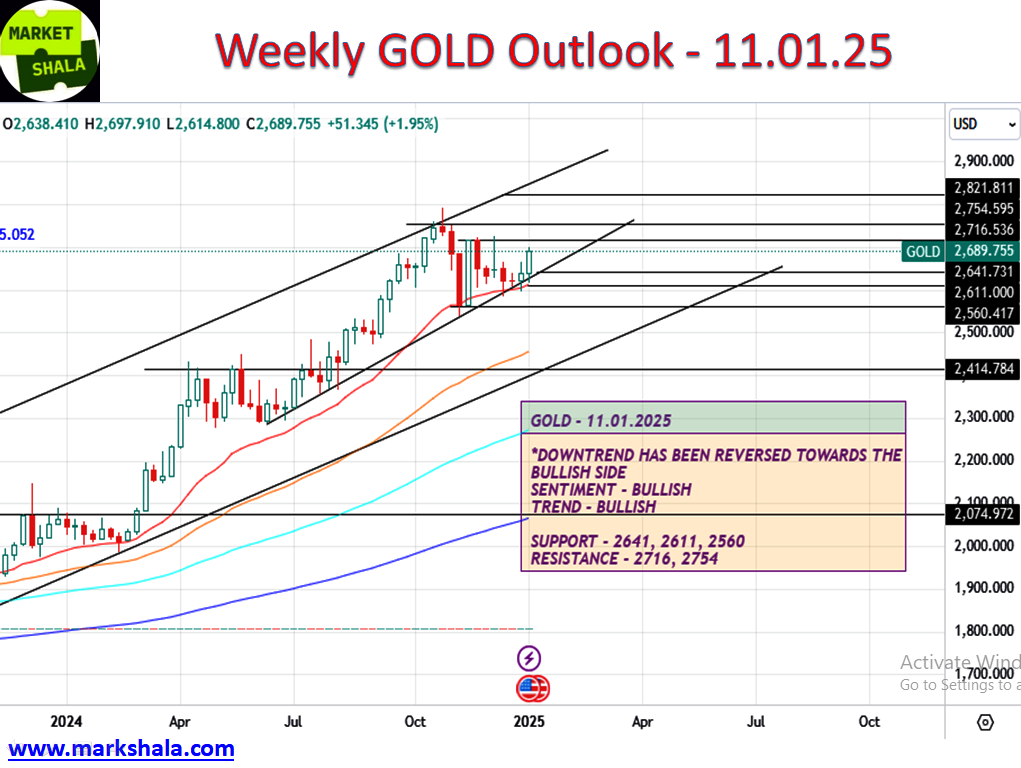
Gold closed the week at $2689.75, showing a gain of 1.95%. Gold has started an upside momentum by breaching the down trend levels as compared to last week. A 6-7 weeks base formation is visible on the weekly charts. Both the sentiment and trend for the coming week are on the bullish side. Hence, keeping the trading strategy bias on the long side, staying long in Gold on moving near the support and above the resistance at the below mentioned levels will have higher chances of getting better trading results.
Support – $2641, $2611, $2560
Resistance – $2716, $2754
Next week sentiment bias – Strong
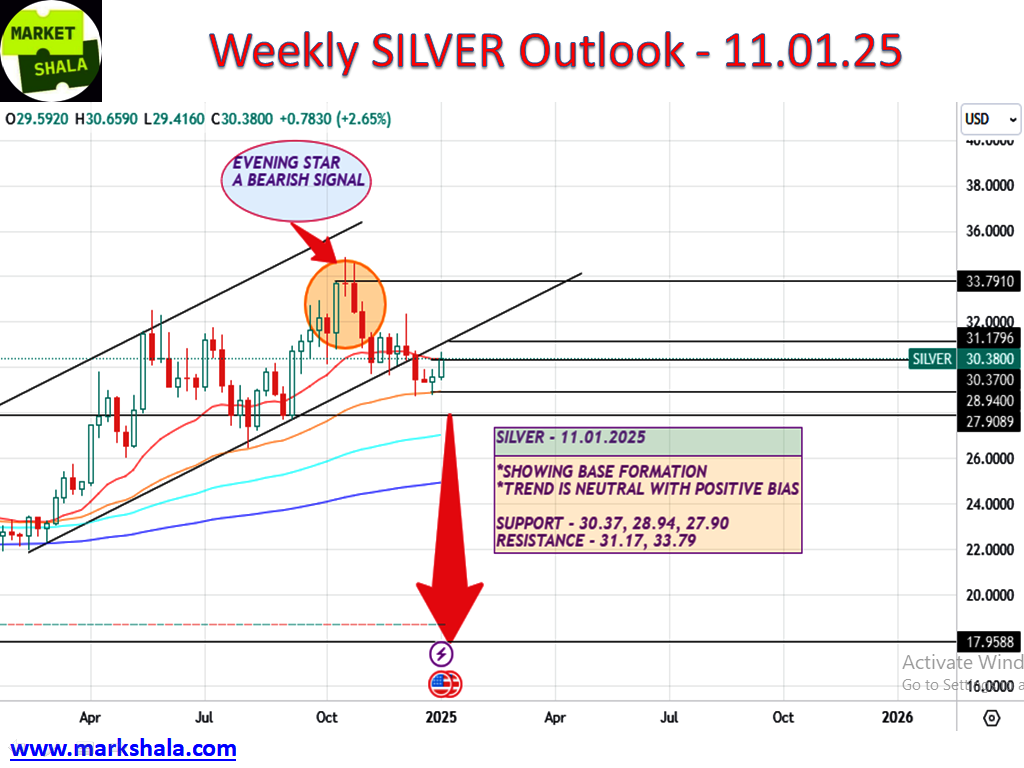
Silver Outlook and Trade Probability
Silver is now showing some strength after falling for several weeks. This week silver closed at $30.38 with a gain of 2.65%. However, no completely bullish trend formation is visible on the weekly charts as of now. But silver closed above the all important WEMAs which is a positive sign from the point of view of the coming week’s movement. Silver should be traded cautiously with a positive bias for the next week. Whenever it breaches the below mentioned resistance levels or comes near the support levels, then the long side trading bias may prove to be beneficial.
Support – $30.37, $28.94, $27.90
Resistance – $31.17, $33.79
Next week sentiment bias – Strong
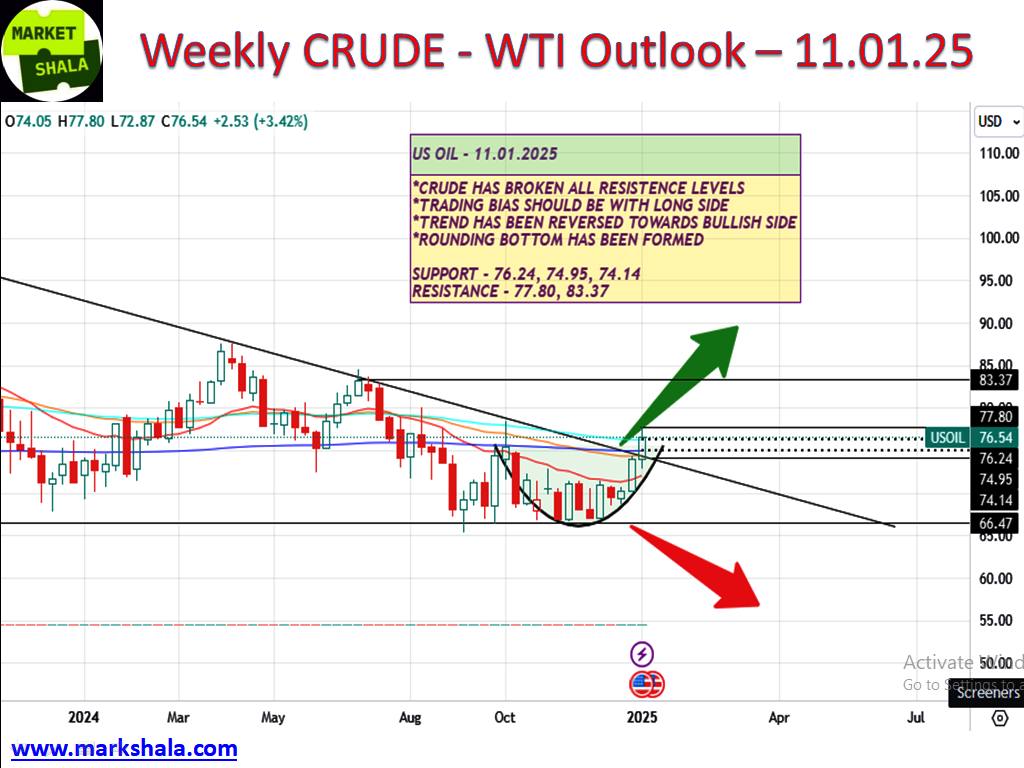
Crude Oil (WTI) Outlook and Trade Probability
Crude oil WTI saw a new rally as crude price breached the downtrend line, confirming what we had predicted last week. Crude is now seen breaking all nearby and important resistance levels and trading in a new and higher territory. It managed to close last week at $76.54 with a gain of 3.42%. Anyway, Crude now has the potential to move towards $83.37 while it is yet to breach its weekly higher highs. Hence, we feel one should plan trades on Crude while keeping a long side trading bias. Whenever crude levels approach the given support levels or breach the resistance levels, taking a long side trade can prove to be beneficial.
Support – $76.24, $74.95, $74.14
Resistance – $77.80, $83.37
Next week sentiment bias – Strong
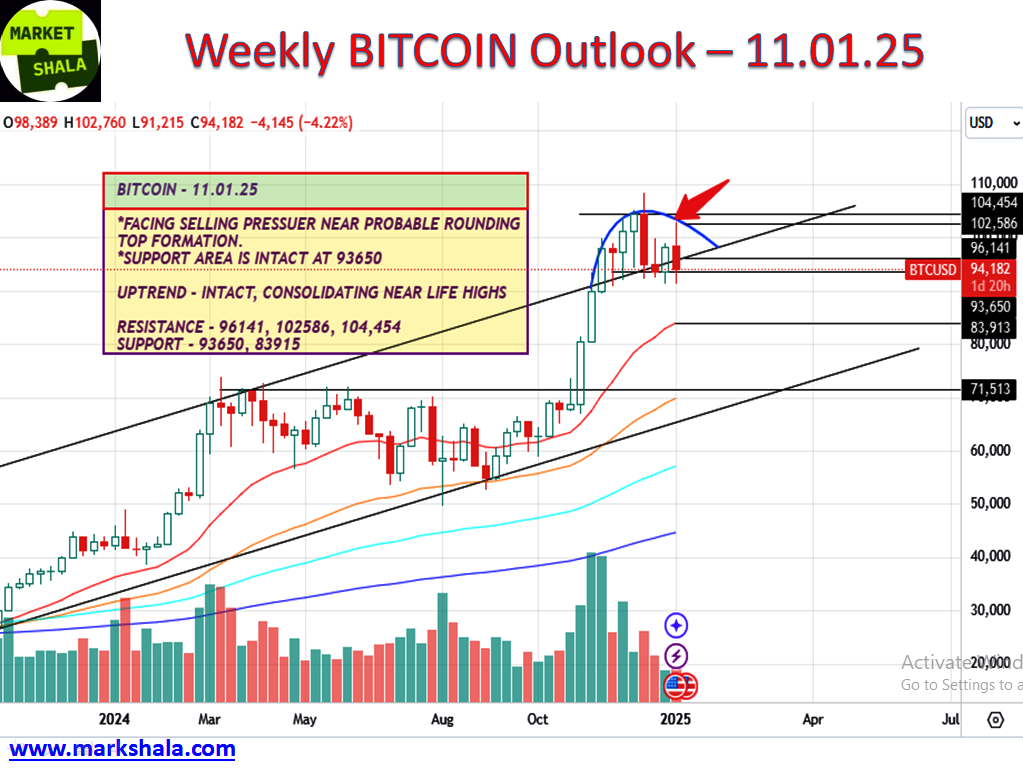
Bitcoin Outlook and Trade Probability
Bitcoin closed this week down by 4.04% at $94702. A closer look at the weekly chart will show how Bitcoin faced selling pressure from the respective levels of our drawn rounding top and is again trying to reversal from a major support area near $93650. Bitcoin is facing selling pressure near its lifetime high levels but its bullish trend is still intact on the weekly charts. Hence one should avoid shorting Bitcoin and it should accumulate slowly whenever it comes near support levels. The rounding top formation is not yet complete; who knows that by absorbing the supply coming at the top levels, Bitcoin will take its steps towards new highs. But here $93650 needs serious observation, if the weekly close comes below this level, then levels for Bitcoin to go down till $83915 will be opened.
Support – $93650, $83915
Resistance – $96141, $102586, $104454
Next week sentiment bias – Neutral with Positive Bias
Conclusion and disclaimer
The content on MarkShala.com is intended for educational and informational purposes only. We specialize in writing blogs on financial planning, investment strategies, economic trends, and related topics. While we strive to provide accurate and reliable information, the content should not be taken as professional financial, investment, or legal advice.
हिंदी अनुवाद
यहां क्लिक करें और हिंदी दर्शक इस विषय पर मेरा यूट्यूब वीडियो देख सकते हैं।
Thank you for tuning in to Market-Shala’s Fintalk Dose — your essential source for insights into the financial markets, India and global economy, Don’t forget to share this story on your network.
Explore More on MarketShala
Stay updated with insights on global events, market analysis, and investment strategies on Markshala, where we aim to make financial education accessible and actionable.
Now, let’s shift gears and unwind! Treat yourself to the soothing tunes of MuziMuffin with his latest release available on Spotify, YouTube and Apple Music. Relax, recharge, and enjoy the vibe!
***********
|| ॐ नमः शिवाय ||