Bitcoin Weekly Techno-Fundamental Analysis: What Traders Should Expect Next Week and Beyond
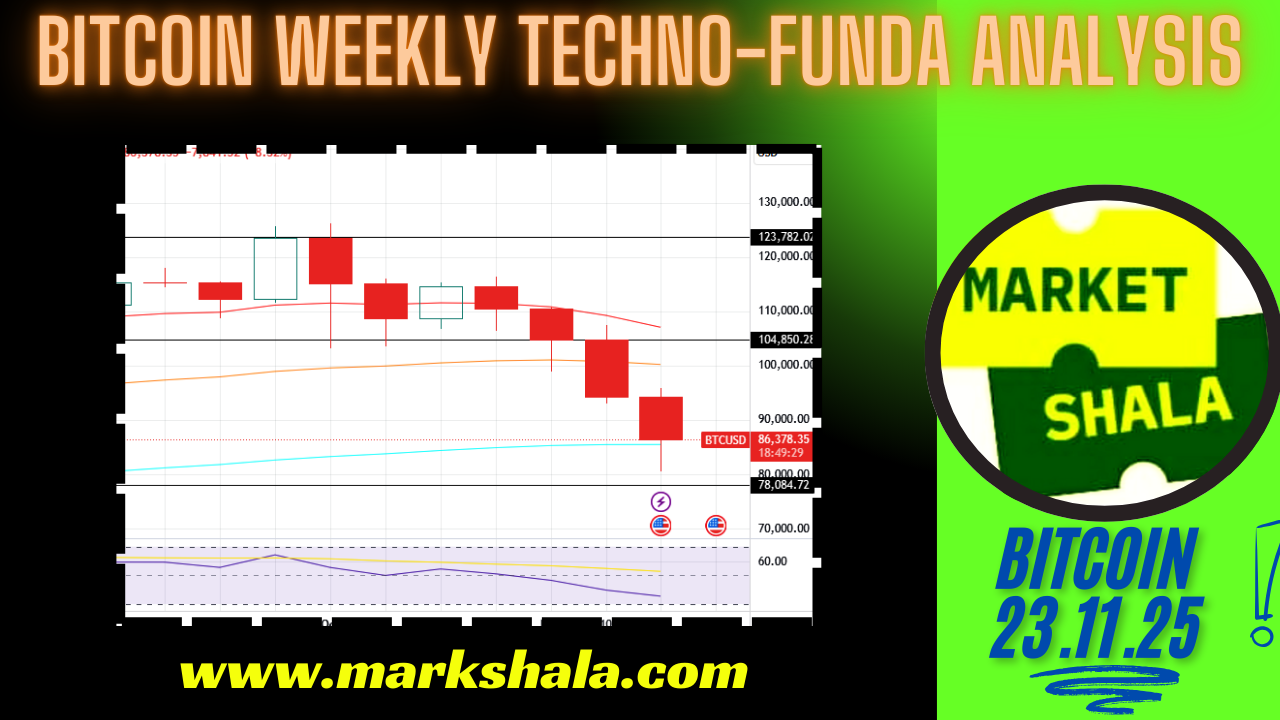
Bitcoin’s weekly chart tells a clear story—the bull market is intact, but the asset is undergoing a healthy but aggressive correction phase, shaking out short-term leveraged traders while giving long-term investors a chance to position smartly.
The candle pattern for the week shows a sharp downward expansion, breaking below short-term moving averages but still respecting long-term market structure. This kind of movement often confuses new traders—some panic and sell at the bottom, while seasoned traders wait for the chart to come to their “real” levels.
Let’s break down what the chart is signaling, and how a real trader or investor should approach Bitcoin in the coming week.
1. Understanding the Technical Structure — Explained for Real Traders
1.1 Trend Outlook
- Long-term trend: Still strongly bullish
- Medium-term trend: Corrective & weakening
- Short-term trend: Oversold but vulnerable
Bitcoin has clearly lost momentum after touching repeated highs around $110,000–$123,000. The failure to hold these highs created a double supply zone, which triggered this multi-week selloff.
1.2 Key Moving Averages and Why They Matter
- BTC broke below the 20-week EMA (speed-breaker line).
- BTC also closed below the 50-week EMA, signaling short-term exhaustion.
- The 100-week EMA around $78,000–$80,000 remains the real battlefield.
Any professional crypto trader knows this:
A correction into the 100-week EMA in a bull cycle is where the institutions reload their positions.
1.3 RSI Behaviour
The RSI dipping towards the 50 zone is not bearish—
it is the textbook point where a long-term trend “resets” before continuation.
2. Fundamental Context: Why Bitcoin Is Falling but the Story Isn’t Broken
Macro Factors Supporting Long-Term Growth
- Institutional inflows via ETFs are still structurally positive.
- Bitcoin supply on exchanges continues to decrease.
- The post-halving supply crunch will fully show effect from mid-2025.
- Dollar liquidity conditions expected to improve once rate cuts begin.
Short-Term Headwinds
- Miners selling due to revenue pressure.
- Profit-booking after Bitcoin’s 2025 highs.
- Rising global macro uncertainty causing temporary risk-off sentiment.
Fundamentally, nothing suggests a long-term trend reversal—only a temporary cooling-off.
3. Important Price Zones: Where Smart Money Acts
Support Zones (Where buyers will emerge)
- $86,000 → weak support (already broken intra-week)
- $80,000 – $78,000 → strong support zone + 100-week EMA
- $72,000 → washout level
- $66,000 → final trendline support (cycle-break zone)
Resistance Zones (Where you should avoid fresh buys)
- $92,000 – $95,000
- $104,000 – $105,000 → major hurdle
- $123,000 → breakout zone where Bitcoin failed multiple times
4. Practical Trading Strategies for the Coming Week
This section is designed for traders who truly want to act on the chart—not just read theory.
A. For Short-Term Traders (1–2 Weeks)
Market Character: Volatile, uncertain, bounce likely but not reliable.
Strategy: Sell on Rise
- Entry (Sell Zone): $92,000 – $95,000
- Stop-Loss: $99,000
- Targets:
- T1: $86,000
- T2: $82,000
- T3: $80,000 (partial profit recommended)
This strategy works because Bitcoin is below major EMAs, and bounces will face heavy selling pressure.Tip:
If you see a sudden 1–2 strong green candles, don’t chase the rally. Wait for price to enter resistance where risk–reward becomes more favourable.
B. For Swing Traders (3–6 Weeks)
Market Character: Medium-term correction with ideal accumulation zones forming.
Strategy: Buy on Dips — Not Before
Swing traders should avoid catching the fall and instead wait for the chart to hit the only logical zone:
- Buy Zone: $80,000 – $78,000
- Stop-Loss: $72,000
- Targets:
- T1: $92,000
- T2: $104,000
- T3: $123,000
This is where institutions accumulate heavily because this level aligns with:
- 100-week EMA
- Previous liquidity pool
- Oversold RSI zone
Tip:
Use staggered buying—never buy all at one price. Add 40% at $80k, 40% at $78k, 20% only if you see strong reversal confirmation.
C. For Long-Term Investors (6–12 Months & Beyond)
Market Character: Strong long-term bull still intact.
Bitcoin corrections in bull cycles are blessings in disguise, not threats.
Strategy: Accumulate Systematically
- Accumulation Range: $78,000 – $86,000
- Long-Term Stop-Loss (Cycle Break): Below $66,000
- Potential 12–18 Month Targets:
- Conservative: $120,000
- Moderate: $150,000
- Bull Case: $180,000 – $220,000
Tip:
Investors should focus on monthly candles, not weekly volatility.
5. How Should a Beginner Approach This Market? (Practical Guidance)
Many readers of your blog are retail traders who get confused during such sharp corrections. Here’s advice that builds real trading discipline:
If the market is falling…
Do not try to “time the bottom.”
Instead, identify a range and accumulate systematically.
If the market bounces…
Let it touch resistance first.
Never buy into momentum at weekly resistance.
If the market panics more…
Use only 20–30% of capital to buy dips.
Always keep bullets ready for deeper moves.
If you are confused…
Stick to long-term investing.
Bitcoin rewards patience more than timing.
6. Final Summary: What to Expect Next Week
Short-Term
- Expect volatility and weak bounces.
- Good for tactical selling opportunities.
Medium-Term
- A bottoming structure likely near $78k–$80k.
- Accumulation zone for swing trades.
Long-Term
- Bull cycle unchanged.
- Corrections create wealth for disciplined investors.
👉 Click Here to join our partner Crypto Investing Platform and unlock MarketShala’s expert-backed crypto investing guidance. For personal assistance, email us at somnath@markshala.com or WhatsApp at +91-8209177236. You may also join our WhatsApp community MarketShalians to stay tuned with regular updates in your wealth creation journey.
Disclaimer
The views and analysis provided above are for educational and informational purposes only and should not be considered as financial or investment advice. Trading and investing in the stock market involve risk, and past performance does not guarantee future results.
***********