Hello folks, welcome to weekly stock market wrap. Trump has not even taken oath yet and it seems that there is a boom in the world markets. Looking at the market trends this week, it seems so. But I would tell you to hold on, if you are a good and true investor then there is no need to be afraid. This is not happening for the first time. And yes, I would like to tell the new investors who have joined this market that they are welcome to the battle field guys, this is the time which will transform you from a young boy to a mature mind, so keep working, such an opportunity for investing comes only 1 or 2 times in a year. If we talk about Indian markets, then we did not get this opportunity in the last 2 years. And if we get it now, then we should not miss it. Because investing at this time will give multibagger returns to your portfolios. In normal market conditions only normal returns can be expected but at a time when the market has fallen by 10 to 15 percent, it is best to continue the investment and if there is additional money then start investing it in a staggered way.
This week was full of happening events. We saw political uncertainties in the European countries. Then on Thursday i.e. 19.12.24 Fed commentary also played an important role to spoil the moods of market. In last 50 years it was first time when Dow index of US markets fell continuously 11 days in row.
Let’s start with what the universe of Price and Action says the story of this week and what else it tells us about the coming week.
Table of Contents
US Markets
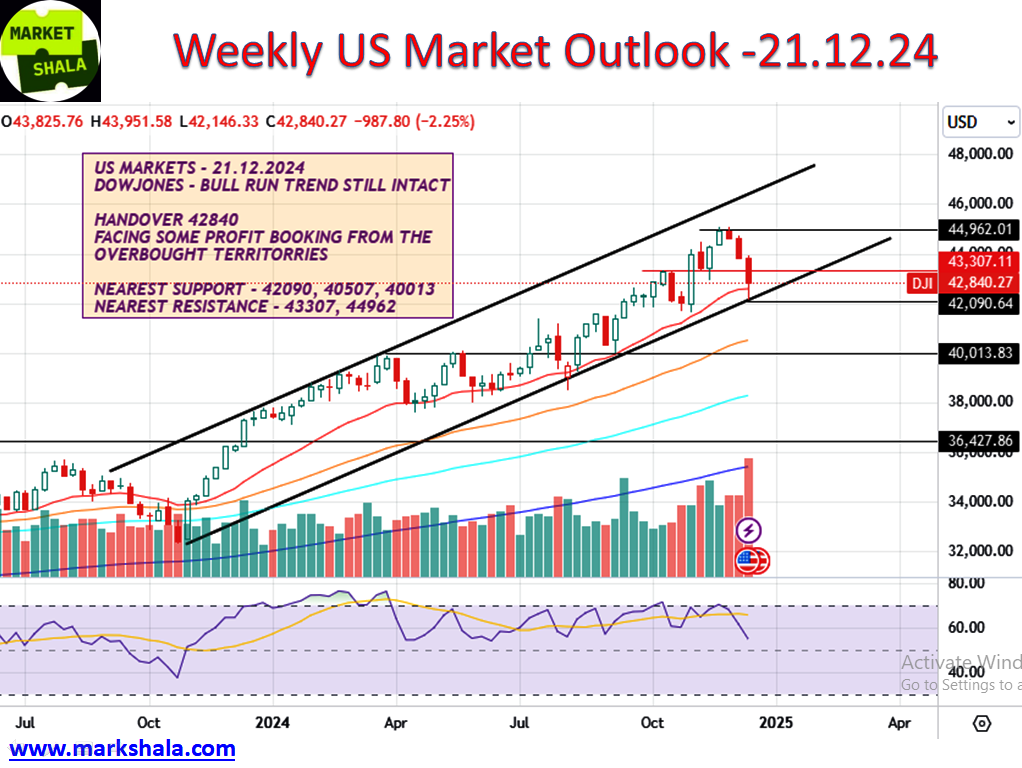
Finally, after 11 days Dowjones showed an up-move of 1.18 percent. It is another matter that till then, due to the impact of its continuous fall, markets all over the world had become devastated. But a ray of hope was shown by Dowjones with the closing of Friday that perhaps a pause can be seen in this downfall.
If you observe the chart carefully, you will find that exactly where we had drawn the lower band of the uptrend at 42090, the Dowjones index got an up-move taking support from there. After 11 consecutive days of decline, this is the first time in the last 50 years, the Dowjones closed in the green on Thursday and Friday. There was a difference in Friday’s closing with a gain of 1.18 percent, while the Nasdaq closed with a gain of .85 percent and the S&P500 closed with a gain of 1 percent which hadn’t happen on Thursday.
The closing of other European markets and Asian markets remained weak as well. It can be expected that some positive impact of Friday’s closing of US markets may be seen on worldwide markets from Monday.
If we look at the weekly outlook, US markets still appear weak. As you can see in the weekly chart, Dowjones showed a negative impact of 2.25 percent during the entire week. The nearest support for Dowjones is currently at 42090. If this support breaks on daily closing basis, then next fall can be seen till 40013 and after that… God forbid this doesn’t happen. There are resistances on the path of upward movement of Dowjones at 43307 and 44962 levels.
A pleasant scenario in the weekly closing was that the bullish trend of Dowjones is still intact. Let’s see what happens next week.
India Market
Nifty
Past week performance: After forming a bottom of 11.50 percent, a decent up-move started in the Indian stock markets which ended with this week. There was also some hopeful buying by FIIs in between but that was of no use. The Nifty index of the Indian market closed after falling 4.77 percent during the entire week. Now should this be called the hawkish commentary by the fed chair or the warning of poor Q3 results of Indian corporate due to which profit booking dominated the markets throughout the week. Bears must have definitely earned profits from short selling but a massive bloodbath was witnessed in the portfolios of long term investors this week.
Coming week forecast: Indian markets are once again standing 10 percent below their peak. If you observe the weekly charts, the effort of up-move of last 3-4 weeks has become zero in a single week. Now you may say that you know everything what has happened now what next?
My answer is that price and action is showing an extreme weakness on the weekly charts which may take the markets even lower in the coming week. A level of 23263 is showing as support which is the lowest level of last month. Before and after this, only the moving averages (50, 100, 200) provide support, which according to me do not need to be analyzed. If the 23263 level is broken, the market can enter a freefall zone, whose next price and action support is visible at 20230. But before that I feel that market support must be taken at some moving average because the market is already standing with a fall of 10 percent. If support is not formed near these levels and the markets fall another 4-5 percent from here, then there is every possibility of value buying coming in the Indian markets, which will work to give strength to the Nifty index.

Bank Nifty
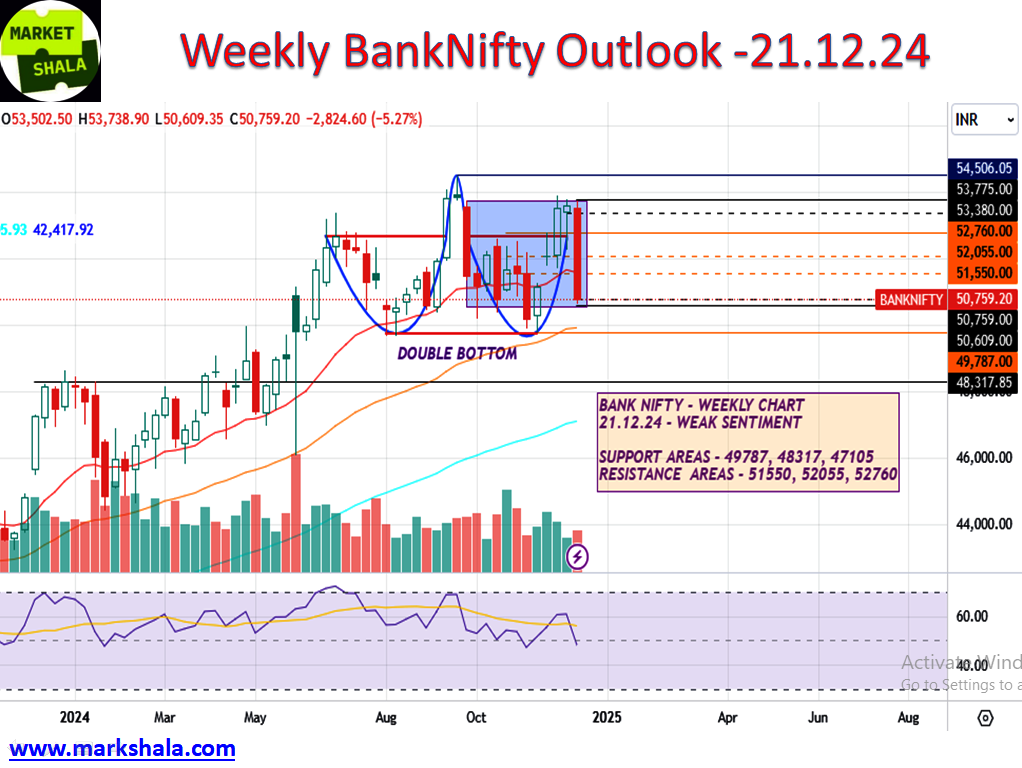
Past week performance: In the previous week we saw the same story in the price and action of Bank Nifty. This week we saw the strength of the last 2-3 weeks ending in a single week. Bank Nifty closed with a loss of 5.27 percent. As I had mentioned earlier, money would definitely have been made through short selling, but investors who had invested for long term in the banking stocks had to see a significant fall in their portfolios. However, banking shares were already experiencing a significant fall. If we look from another perspective, from the perspective of long term investment, the shares of Banks and NBFCs sector are appearing quite cheap.
Coming week forecast: If we observe this week’s chart, a big bearish candle has formed on the weekly charts which can be termed as a sign of weakness. A double bottom area is visible as a support which is at the levels of 49787. If it breaks, then the next support will be seen at 48317. If the levels consolidate around any support for few days, then some movement can be predicted from there. Right now, only weakness is visible on the charts. The double bottom support should act as a crucial support.
Stock of the week (Long/Short)
Long Side Trade: This week we haven’t got any Long Side Stock Trade idea into our setup and as we always say when your setup is not giving you trade better you stay away from taking trade. Because not taking trade is also equivalent to take trade in the trading business.
Short Side Trade: This week ICICIPRULI is coming in our setup where we will initiate the SELL side call. Levels and Chart image is from the cash levels and it needs to be converted into the future levels if the position is being made in FnO.
Sell at the CMP / 653.00, Stop Loss at 674.00, Target at 614.00 with a Risk Reward Ratio of 1:2.

Alternative Investments
Gold Trade
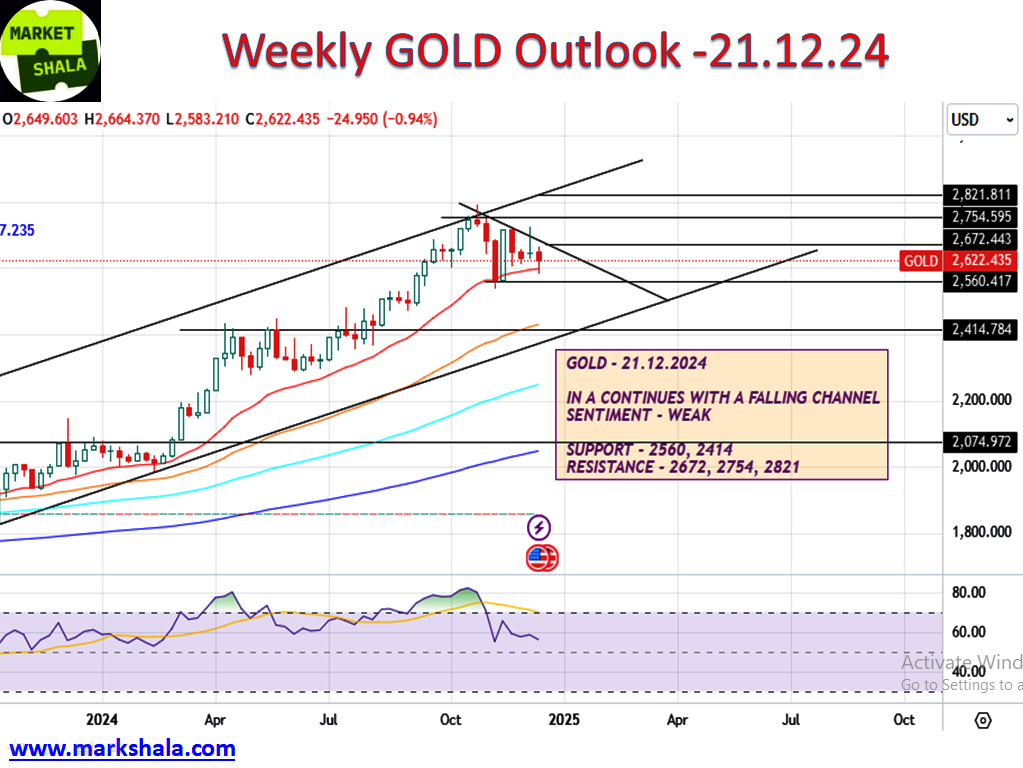
Gold this week lost 0.94 percent from the last week closing levels. This week gold closed at $2622.43. Gold prices are feeling the pressure near to its lifetime highs and downward trend-line. We can see weakness in the price and action of the gold this week and it may continue in the next week as well. It should be traded on short side till it is below it’s resistance area $2672 trading bias must remain at the short side. If it decisively closes above $2672 then the trading bias can be switched towards the bullish side. Refer the weekly chart image for the other respective levels.
Silver Trade
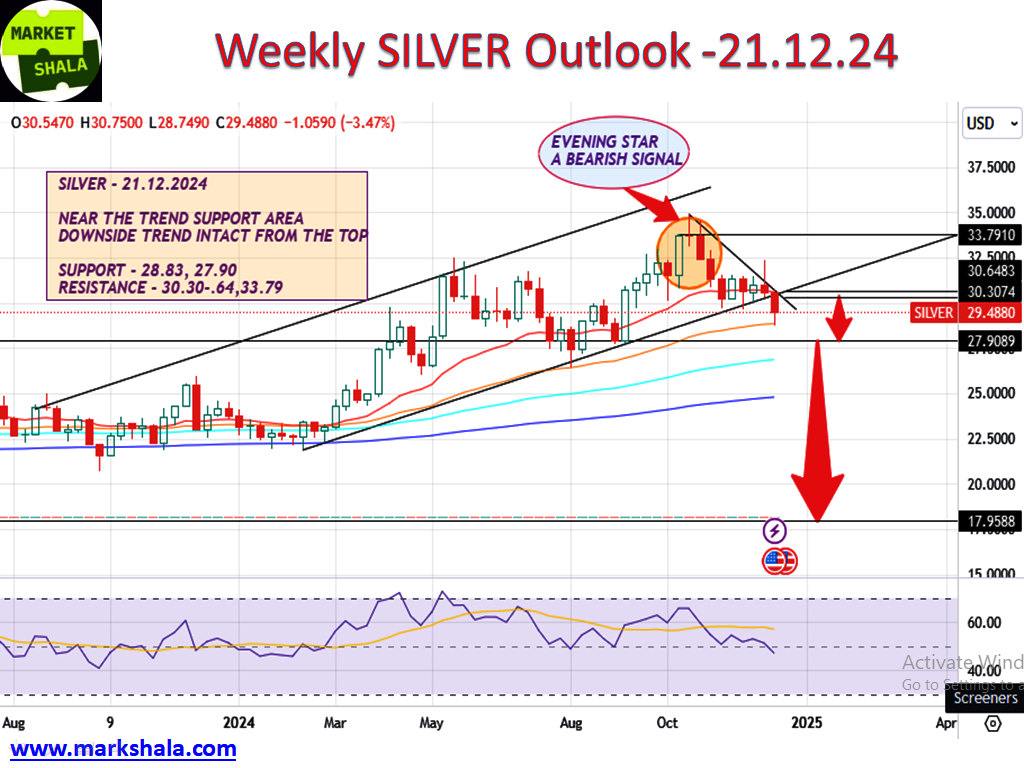
Silver showed weakness consecutively second week. Few weeks ago a bearish formation EVENING STAR appeared on the weekly chart and it’s impact is continuing. Though on Friday a bit of strength has shown by the Silver but weekly it has lost 3.47 percent from the last week close. Silver is still showing weakness on the charts hence it should be traded with short side biasness. It’s near term support areas are $28.83 and $27.90. It’s near term resistance will be $30.30 – .64 and $33.79. If Silver give close above $30.64 on daily chart then you will be required to switch your trading bias towards the long side. Refer the weekly chart image for the other respective levels and formation.
Crude Oil (WTI) Trade
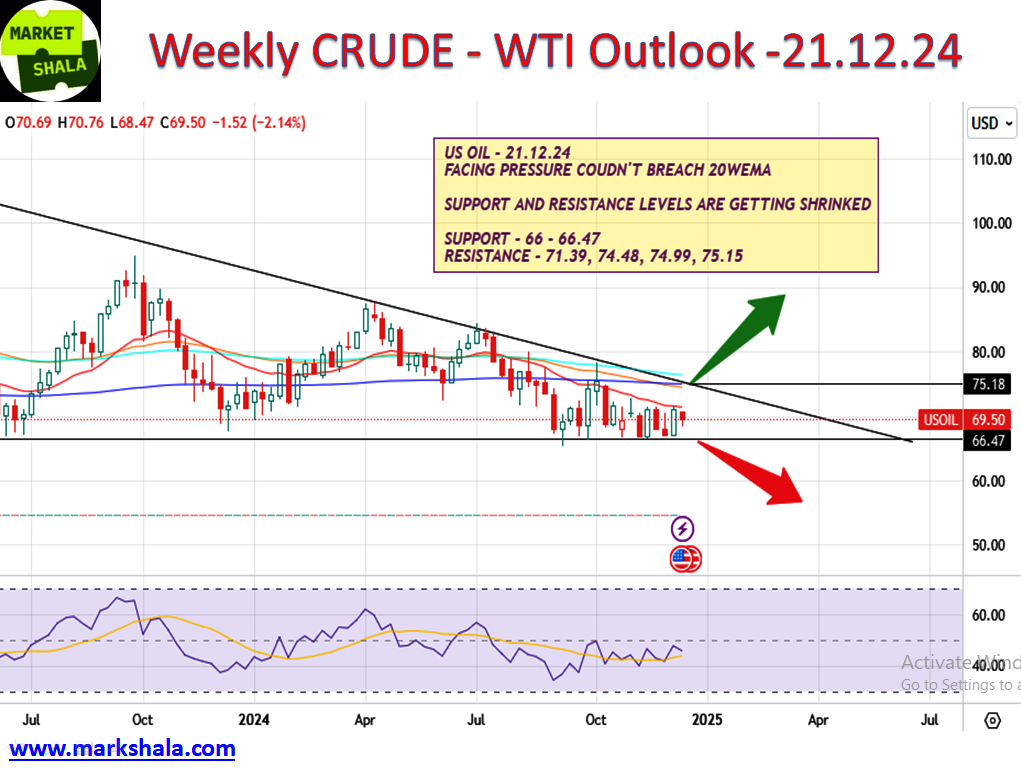
This week crude oil showed some weakness and closed down 2.14 percent on weekly basis. Overall weakness is still there on the charts and a strategy of shorting crude oil should be adopted when it comes near the resistance levels. This same strategy made good money for the traders last week also. Nearby support levels will be $66 and $66.47 and resistance levels will be $71.39, $74.48, $74.99 and $75.15. There is a possibility of bullish momentum in crude oil starting only above $75.18 which is still quite far from the current levels. Refer the weekly chart image for the other respective levels and formation.
Bitcoin Trade
Hot topic of the investing world, none other than Bitcoin, this week we will also share with you the coverage of Bitcoin. This week Bitcoin closed with a decline of 6.62 percent. Bitcoin is now trading in an overbought zone near its lifetime highs. Profit taking from lifetime highs is not surprising. After cooling off a bit, it will again gain momentum and there is a strong possibility of it dominating as the bullish trend is still continuing.
Nearby support levels for Bitcoin are $94454, $80122 and $71513 and nearby resistance levels will be $104,454. Bitcoin should be long near the support levels and once it crosses its resistance level at $104,454 on a daily closing basis, it would be wise to trade it with a bias to the long side. Refer the weekly chart image for the other respective levels and formation.

Conclusion and disclaimer
The content on MarkShala.com is intended for educational and informational purposes only. We specialize in writing blogs on financial planning, investment strategies, economic trends, and related topics. While we strive to provide accurate and reliable information, the content should not be taken as professional financial, investment, or legal advice.
***********
हिंदी अनुवाद
यहां क्लिक करें और हिंदी दर्शक इस विषय पर मेरा यूट्यूब वीडियो देख सकते हैं।
Thank you for tuning in to Market-Shala’s Fintalk Dose — your essential source for insights into the financial markets, India and global economy, Don’t forget to share this story on your network.
Explore More on MarketShala
Stay updated with insights on global events, market analysis, and investment strategies on Markshala, where we aim to make financial education accessible and actionable.
Now, let’s shift gears and unwind! Treat yourself to the soothing tunes of MuziMuffin with his latest release available on Spotify, YouTube, Apple Music and Amazon Music. Relax, recharge, and enjoy the vibe!

