
Hello MarketShalians, Welcome to the Weekly Indian and World Market Wrap. The week is over and we are here before you with a written review of the worldwide markets. It seems that the whole crisis has come to the fore on the emerging markets. Being an active Indian investor, I can understand very well how it feels when you have seen at that time when world markets are moving in one direction but your Indian market was measuring new highs every week, showing outperformance to everyone and now the situation has become completely opposite, no matter how many positive signals there are worldwide, by the end of the day Indian markets have to witness a decline. The main reason behind this decline is not hidden from anyone and that is the continuous selling by FIIs. Seems FIIs are getting better returns in the markets of developed countries and this is the only reason why they are withdrawing their money from the Indian markets and as soon as the value of Indian markets becomes a little soft, the FIIs will once again take control of the Indian markets. Now we will have to be satisfied with this logic because no positive news seems to have any impact on the selling by FIIs. Be it RBI’s effort to infuse liquidity in the markets or a good budget, everything seems to be going in vain.
Somehow the corporate results of Q3 are also not looking so miraculous that they can encourage FIIs to invest on current valuation. The eyes of the market have also now turned towards the Q4 results but it is still difficult to say with confidence whether the situation will change a little in Q4 or will we see the same story? Only time will answer this. If one looks at the major Indian indices, the PE ratio of NIFTY 50 has now come down from the highs of 24.4 to 20.4 but perhaps these decreased valuations do not yet appear to be mouth watering for the FIIs. If we talk of the world markets, there is an atmosphere of joy and gaiety. U.S. and EU all the markets appeared to be working near new highs. The Trump tariff terror is still continuing and it has affected the emerging markets a lot as it was believed that the decision taken by Trump towards equalizing the tariffs on both sides will have maximum impact on economies like India, Brazil and other emerging countries. At such a time, we can say only one thing to the investors of Indian markets that whatever be the reason, a fall of 10-15 percent mostly witnessed in the markets once in a year and that is the time when if you are able to increase your investment or if you are unable to do so and at least do not sell your existing investment in good stocks and mutual funds, the coming time is ready to reward you. SIP or Rupee / Dollar Cost Averaging prove to be a better strategy for your investment in such scenarios. So let us now see what should be the trading and investing strategy for the coming week in different asset classes and what the technical charts are saying!
Table of Contents
US Stock Market and Dowjones Trade Probabilities
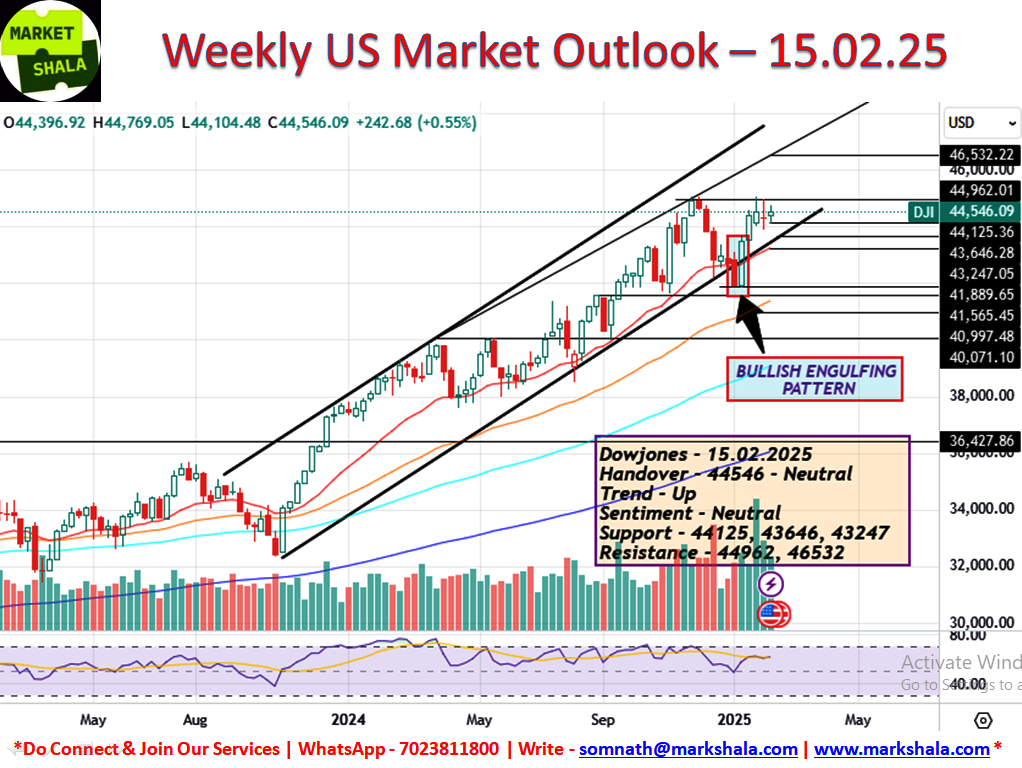
Last week we had predicted that Dowjones would remain in a pressure situation and we witnessed similar price action. The Dowjones index has been in a consolidation phase for 3 consecutive weeks near its lifetime high. The strength Dowjones is getting due to an uptrend on the charts, it is not showing a decisive sell and on the other hand, Trump’s terror is preventing it from moving further towards new highs. If we look at this week, Dowjones closed with a gain of .55% and 242 points but looking at its position on the charts, it is still a bit difficult to predict any one-way movement.
Both-way movements can be seen in Dowjones next week as well and one should be ready to trade Dowjones in both directions near the levels given below. Global conditions are also pointing towards this as you never know when and which order will be issued by the U.S. President Trump but the market is ready to manage on any such situation on both sides which is also visible on the charts.
Respective Resistance and Support Levels are as follows:
Support – 44125, 43646, 43247
Resistance – 44962, 46532
Sentiment – Neutral
Trend – Up
Trade Bias – Both Side
India Stock Market and Trade Probabilities
Nifty Outlook and Trade Probability
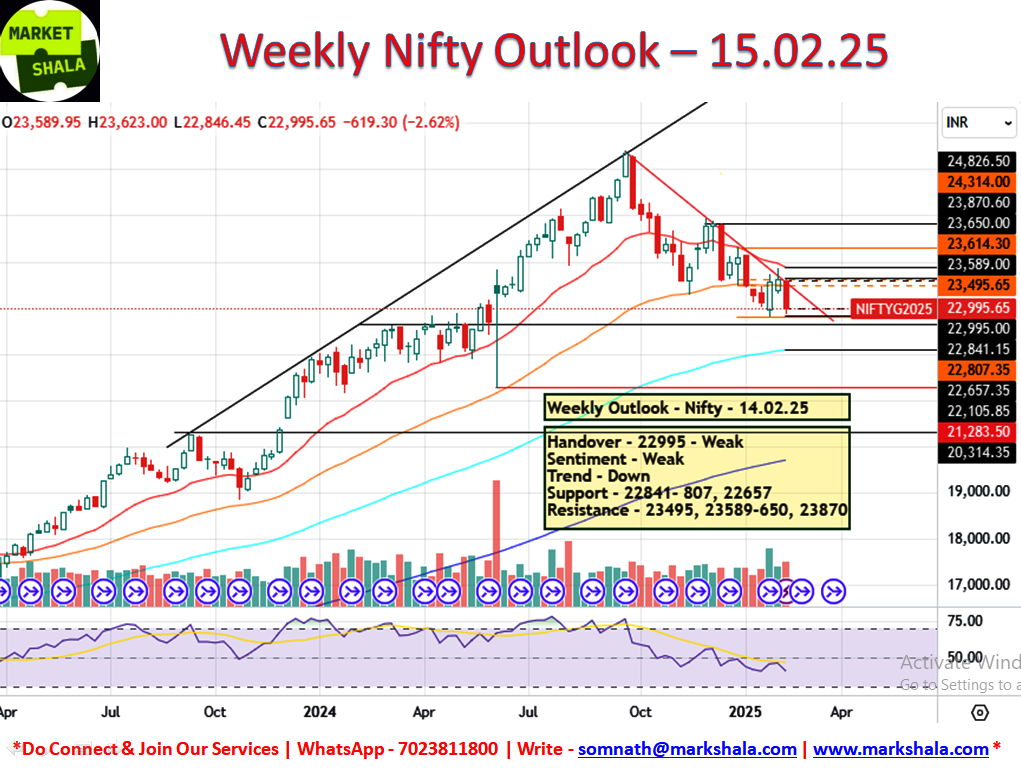
This week Nifty completely destroyed the strength of the previous two weeks. We had anticipated this last week and the reason was Nifty closing very close to the upper band of the down trend, and this doubt got confirmed in reality this week. This week Nifty showed a big fall of -2.62% and -619 points. Due to this, when you look at the weekly charts, the handover, sentiment and trend all appear to be weak. But apart from all this, the other aspect of learning is that Nifty is near a strong support which will act as a major support for it and if it breaks, it will invite a new fall and that support level is 22800 on Nifty future charts.
While looking at the trading strategy for next week, one should look for opportunities to trade on both the sides. If Nifty decisively closes the day below 22800, we will switch our trading bias towards the short side.
Respective Resistance and Support Levels are as follows:
Support – 22841-807, 22657
Resistance – 23495, 23589-650, 23870
Sentiment – Weak
Trend – Down
Trade Bias – Both Sides (Conditional)
Bank Nifty Outlook and Trade Probability
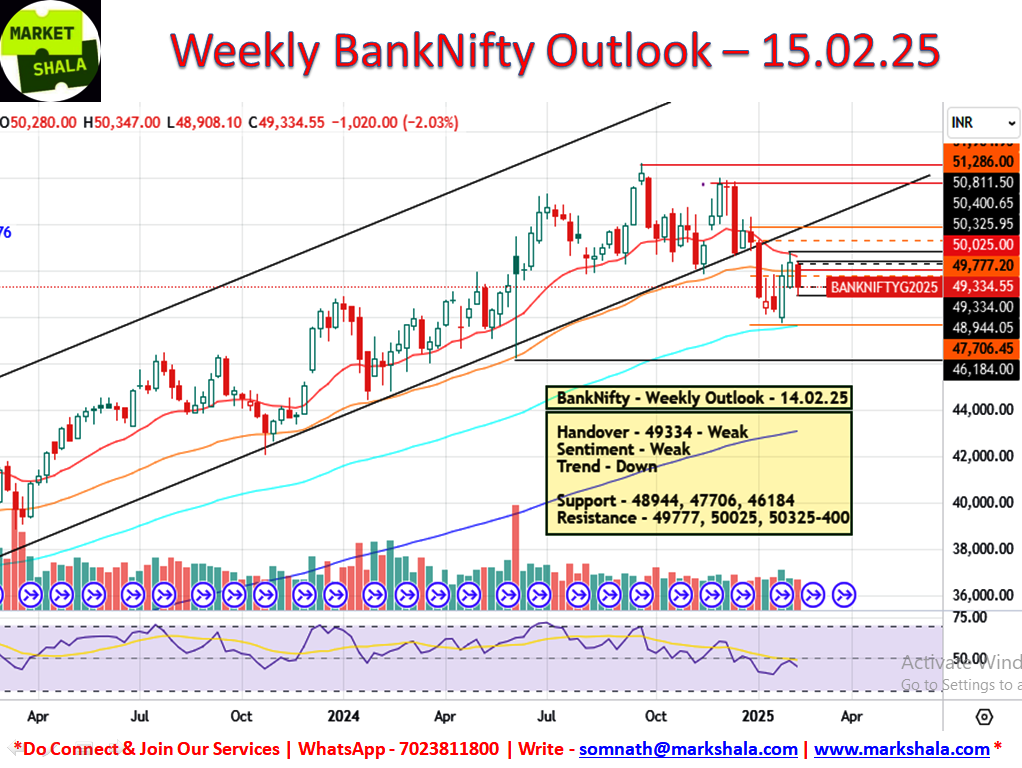
A similar story was seen in Bank Nifty as well, this week Bank Nifty closed with a fall of -2.03% and -1020 points. The one discomfort visible in Bank Nifty is its chart, in which clear trend formation is not visible; however trend, sentiments and handover all are weak. Due to the chart formation being messy, we will try to trade Bank Nifty intraday only and will look for opportunities to trade on both sides near the levels given below.
Respective Resistance and Support Levels are as follows:
Support – 48944, 47706, 46184
Resistance – 49777, 50025, 50325-400
Sentiment – Weak
Trend – Down
Trade Bias – Both Side (Intraday Only)
Stock of the week (Long/Short)
Long Side Trade
This week we haven’t got any Long Side Stock Trade idea into our setup and as we always say when your setup is not giving you trade better you stay away from taking trade. Because not taking trade is also equivalent to take trade in the trading business.
Short Side Trade
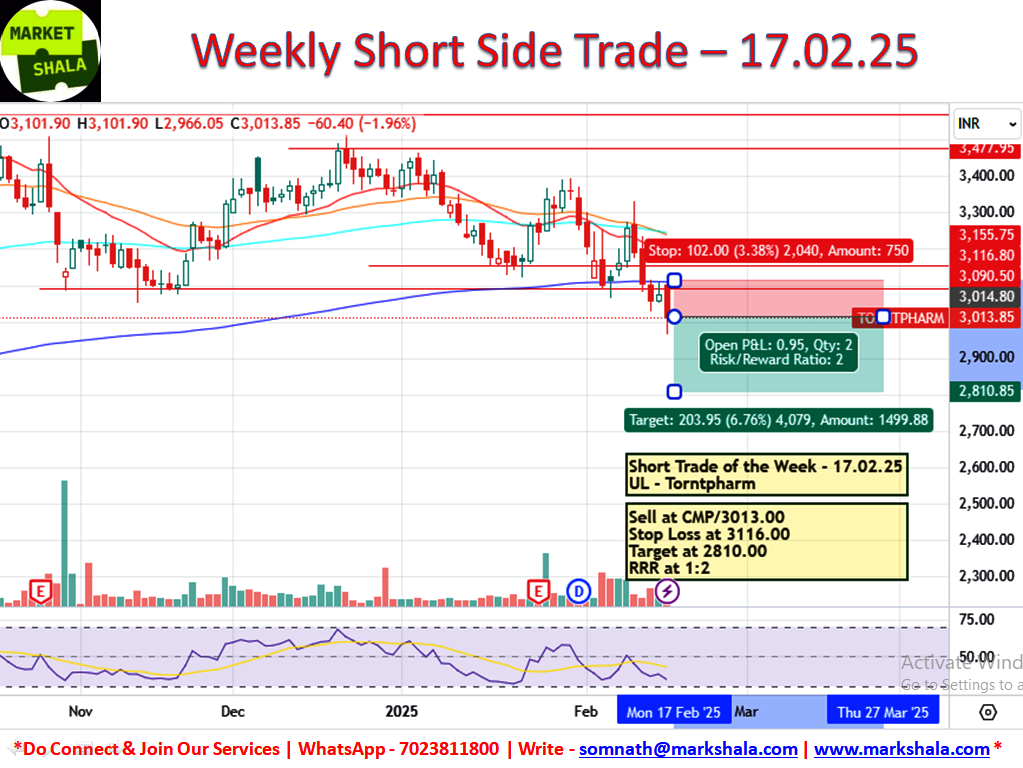
This week TORNTPHARM is coming in our setup where we will initiate the SHORT side trade. Levels and Chart image is from the cash levels and it needs to be converted into the future levels.
Sell at the CMP/3013.00, Stop Loss at 3116.00, Target at 2810.00 with a Risk Reward Ratio of 1:2
Alternative Investments
Gold Outlook and Trade Probability
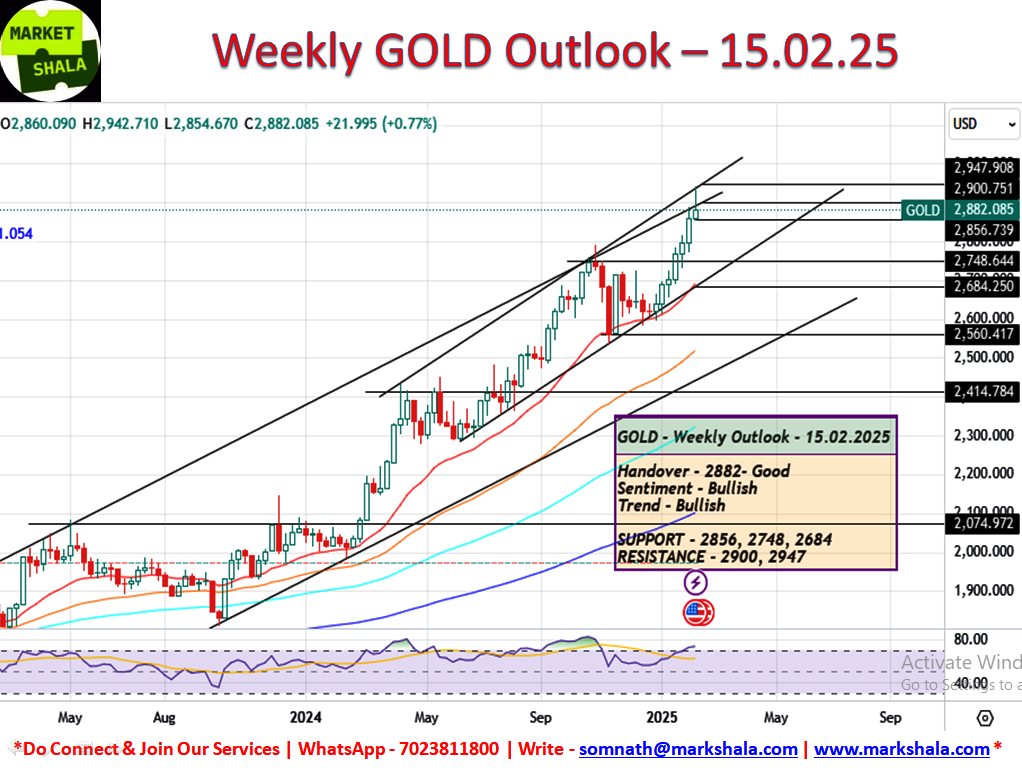
Gold gave a good upside movement last week as per our prediction and traders would have got a good profit on the long side as well. Gold managed to close at $2882.08 with a gain of .77%. But it can be risky to form a trading strategy for next week by looking at the closing level of Gold and its rise. Our trading strategy would be to follow a cautious approach next week by looking at the weekly candle of the type of profit collection from its lifetime high level. Next week we will remain long on gold until $2856 level is broken on daily closing basis and if the levels are broken then we will look for opportunities to trade on both sides near the below given levels.
Respective Resistance and Support Levels are as follows:
Support – $2856, $2748, $2684
Resistance – $2900, $2947
Sentiment – Strong
Trend – Up
Trade Bias – Long Side (Conditional)
Silver Outlook and Trade Probability
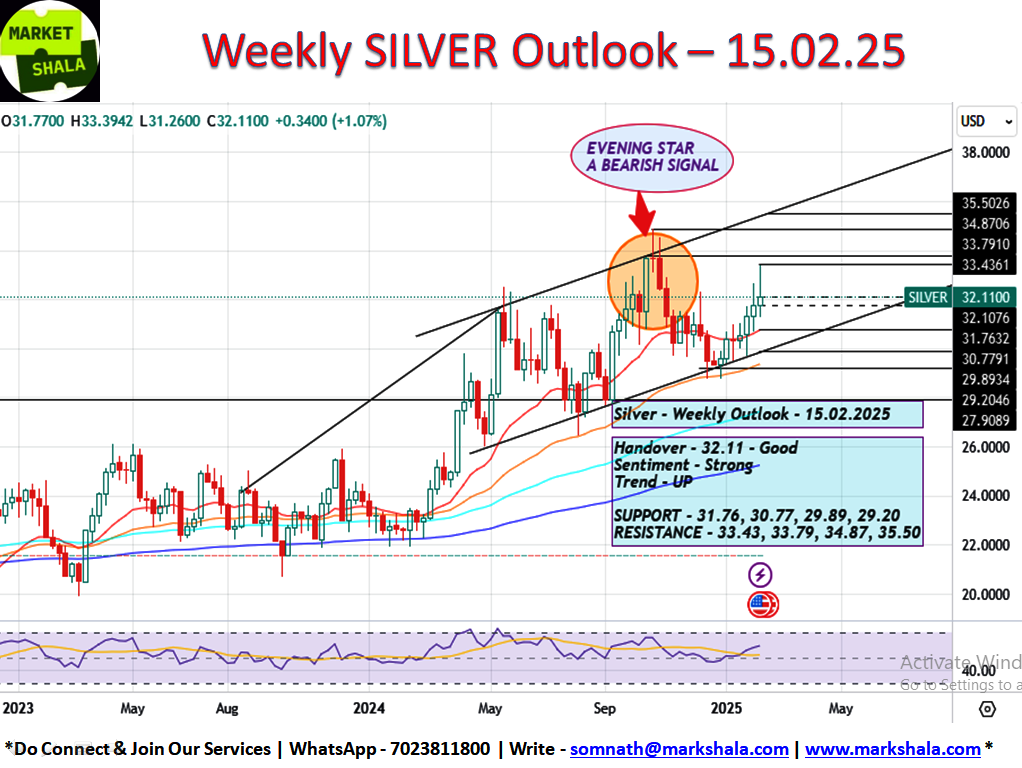
The price and action of Silver also remained similar to that of Gold but its weekly candle formation appears better. It has formed a higher high and higher low in a good manner and is still much below its lifetime highs which are projecting its up-move potential in a better way. But one observation which needs to be kept in mind is that Silver also like Gold has become a victim of selling pressure from its weekly highs due to which a cautious approach needs to be brought into your trading strategy for the coming week. Our trading strategy for next week will be on long side for Silver. We will try to find long side trades on Silver near the below given levels.
Respective Resistance and Support Levels are as follows:
Support – $31.76, $30.77, $29.89, $29.20
Resistance – $33.43, $33.79, $34.87, $35.50
Sentiment – Strong
Trend – Up
Trade Bias – Long Side
Crude Oil (WTI) Outlook and Trade Probability
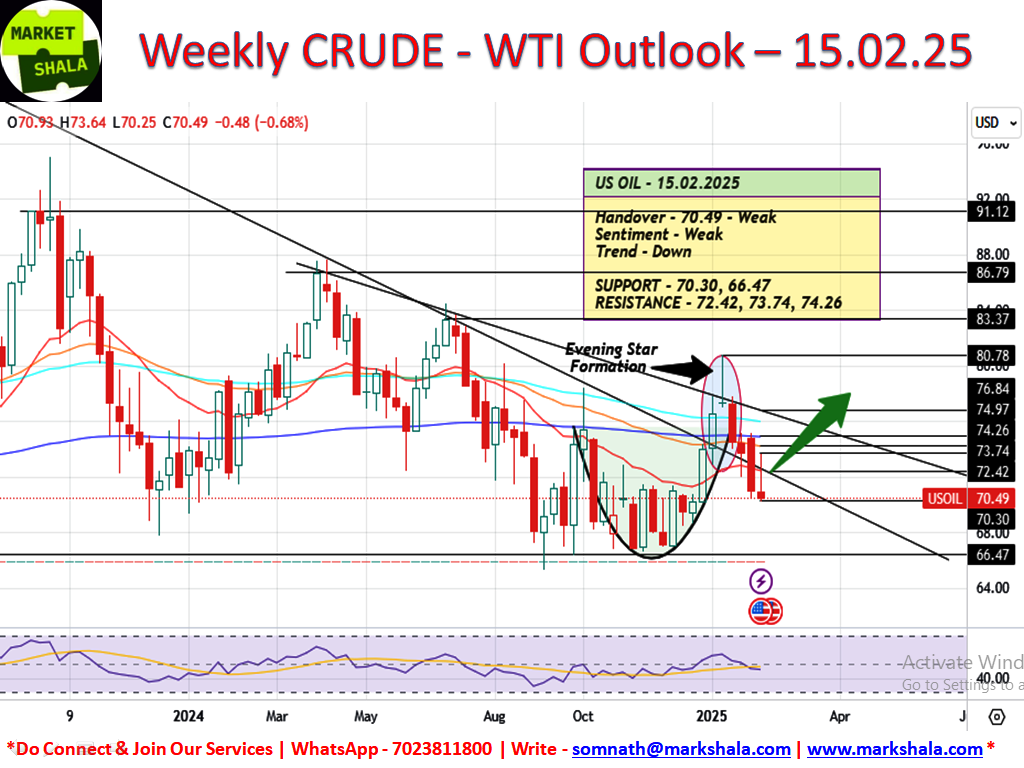
The Evening Star effect on crude is intact. This week crude closed with a fall of -0.68% on the WTI index. It has been proved once again that the success probability percentage of price and action on bigger frames is quite good. If you look at the weekly charts of crude, you will see quite nearby resistances for short side trade. For the next week as well, we will focus on the strategy of shorting crude. As long as crude does not come near $66.47 or gives a daily close above $72.42, our trading bias will remain on the short side.
Respective Resistance and Support Levels are as follows:
Support – $70.30, $66.47
Resistance – $72.42, $73.74, $74.26
Sentiment – Weak
Trend – Down
Trade Bias – Short Side
Bitcoin Outlook and Trade Probability
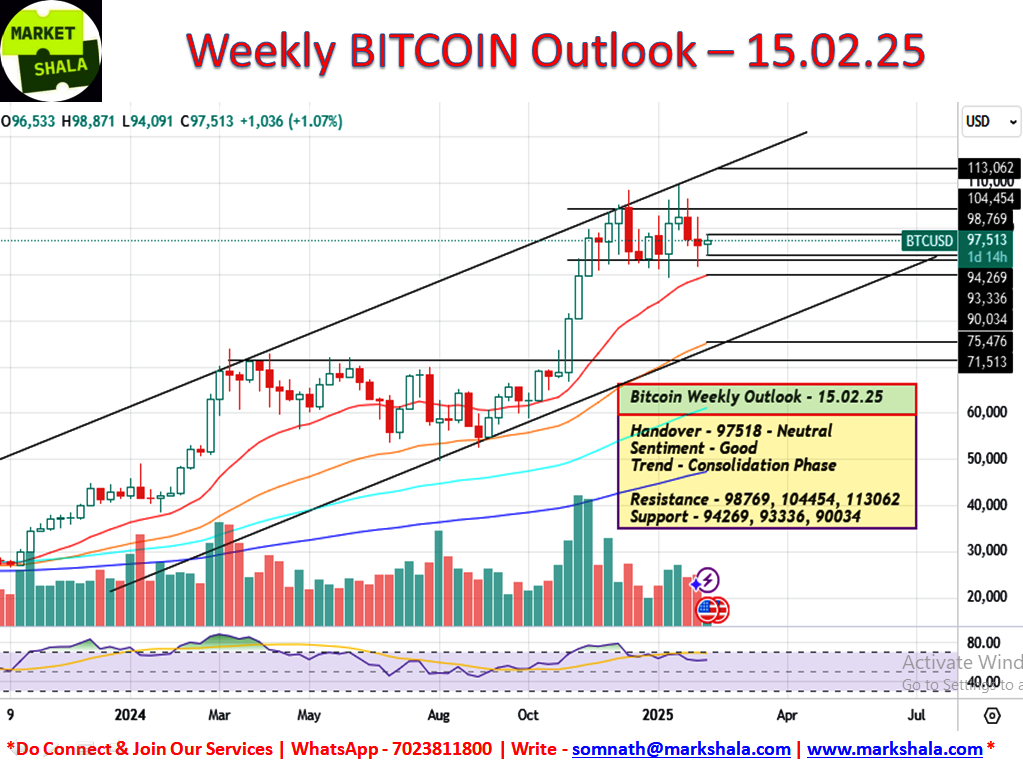
Bitcoin has been in a consolidation phase for more than 3 months. Due to its volatility, you get to see big weekly highs and lows but if you observe the weekly price and action carefully, you will see the price of Bitcoin moving in a range between $93000 to $104000, its open and close on a weekly basis. As I always say, Bitcoin is a highly volatile asset class, whose volatility is not easy for every trader to handle. According to me Bitcoin should be 5% to 10% of your long term investing portfolio and if it is not so then it can accumulate whenever it comes near its support levels.
Respective Resistance and Support Levels are as follows:
Support – $94269, $93336, $90034
Resistance – $98769, $104454, $113062
Sentiment – Volatile Consolidation
Trend – Consolidation Phase
Trade Bias – Long Side
Click Here and start your journey to invest in your first Stock, Index, Commodity and move ahead with your wealth creation journey.
Click Here and start your journey to invest in your first crypto currency.
Conclusion and disclaimer
The content on MarkShala.com is intended for educational and informational purposes only. We specialize in writing blogs on financial planning, investment strategies, economic trends, and related topics. While we strive to provide accurate and reliable information, the content should not be taken as professional financial, investment, or legal advice.
How did you like our blog? Do share your thoughts in the comment box. Your thoughts will inspire us to bring more good and relevant content for you so that we can enhance the quality of our content and you can benefit more.
Thank you for tuning in to MarketShala’s Fin Dose — your essential source for insights into the financial markets, India and global economy, Don’t forget to share this story on your network.
Explore More on MarketShalaStay updated with insights on global events, market analysis, and investment strategies on Markshala, where we aim to make financial education accessible and actionable.Now, let’s shift gears and unwind! Treat yourself to the soothing tunes of MuziMuffin with his latest release available on Spotify, YouTube and Apple Music. Relax, recharge, and enjoy the vibe!
Hindi Translation of the Story
हिंदी अनुवाद
साप्ताहिक शेयर बाजार की समीक्षा: भारत और वैश्विक रुझान – विजेता, हारने वाले और आगे क्या – 15.02.2025!
नमस्कार मार्केटशालियन्स, साप्ताहिक भारतीय और विश्व बाजार समीक्षा में आपका स्वागत है। सप्ताह समाप्त हो गया है और हम आपके सामने दुनिया भर के बाजारों की लिखित समीक्षा लेकर आए हैं। ऐसा लगता है कि उभरते बाजारों पर पूरा संकट सामने आ गया है। एक सक्रिय भारतीय निवेशक होने के नाते, मैं अच्छी तरह से समझ सकता हूं कि कैसा लगता है जब आपने उस समय देखा हो जब दुनिया के बाजार एक दिशा में आगे बढ़ रहे हों लेकिन आपका भारतीय बाजार हर हफ्ते नई ऊंचाई छू रहा हो, सबको मात दे रहा हो और अब स्थिति बिल्कुल विपरीत हो गई हो, चाहे दुनिया भर में कितने भी सकारात्मक संकेत क्यों न हों, दिन के अंत तक भारतीय बाजारों में गिरावट आनी ही है। इस गिरावट के पीछे मुख्य कारण किसी से छिपा नहीं है और वह है एफआईआई द्वारा लगातार बिकवाली। लगता है कि विकसित देशों के बाजारों में एफआईआई को बेहतर रिटर्न मिल रहा है और यही एकमात्र कारण है कि वे भारतीय बाजारों से अपना पैसा निकाल रहे हैं और जैसे ही भारतीय बाजारों का मूल्य थोड़ा नरम पड़ेगा, एफआईआई एक बार फिर भारतीय बाजारों पर कब्जा कर लेंगे। अब हमें इसी तर्क से संतुष्ट होना पड़ेगा क्योंकि कोई भी सकारात्मक खबर एफआईआई की बिकवाली पर कोई असर नहीं डालती दिख रही है। चाहे वह बाजारों में नकदी डालने का आरबीआई का प्रयास हो या अच्छा बजट, सब बेकार होता दिख रहा है। किसी तरह तीसरी तिमाही के कॉरपोरेट नतीजे भी इतने चमत्कारी नहीं दिख रहे हैं कि वे मौजूदा मूल्यांकन पर एफआईआई को निवेश के लिए प्रोत्साहित कर सकें। बाजार की निगाहें भी अब चौथी तिमाही के नतीजों पर टिक गई हैं लेकिन अभी भी पूरे भरोसे के साथ यह कहना मुश्किल है कि चौथी तिमाही में स्थिति थोड़ी बदलेगी या फिर वही कहानी देखने को मिलेगी? इसका जवाब तो आने वाला समय ही देगा। अगर भारत के प्रमुख सूचकांकों पर नजर डालें तो निफ्टी 50 का पीई अनुपात 24.4 के उच्चतम स्तर से घटकर 20.4 पर आ गया है, लेकिन शायद यह घटी हुई वैल्यूएशन अभी भी एफआईआई के लिए मुंह में पानी लाने वाली नहीं दिख रही है।
अगर विश्व बाजारों की बात करें तो वहां भी खुशी और उल्लास का माहौल है। अमेरिका और यूरोपीय संघ के सभी बाजार नई ऊंचाइयों के करीब काम करते नजर आए। ट्रंप का टैरिफ आतंक अभी भी जारी है और इसने उभरते बाजारों को काफी प्रभावित किया है क्योंकि ऐसा माना जा रहा था कि ट्रंप द्वारा दोनों तरफ टैरिफ को समान करने की दिशा में लिए गए फैसले का सबसे ज्यादा असर भारत, ब्राजील और अन्य उभरते देशों जैसी अर्थव्यवस्थाओं पर पड़ेगा। ऐसे समय में हम भारतीय बाजारों के निवेशकों से एक ही बात कह सकते हैं कि कारण चाहे जो भी हो, बाजारों में 10-15 फीसदी की गिरावट साल में एक बार देखने को मिलती है और यही वह समय होता है जब आप अपना निवेश बढ़ा पाते हैं या नहीं बढ़ा पाते हैं और कम से कम अच्छे शेयरों और म्यूचुअल फंड में अपने मौजूदा निवेश को नहीं बेचते हैं, तो आने वाला समय आपको पुरस्कृत करने के लिए तैयार है। ऐसे परिदृश्यों में आपके निवेश के लिए SIP या रुपया/डॉलर कॉस्ट एवरेजिंग एक बेहतर रणनीति साबित होती है। तो आइए अब देखते हैं कि आने वाले सप्ताह के लिए अलग-अलग एसेट क्लास में ट्रेडिंग और निवेश की रणनीति क्या होनी चाहिए और तकनीकी चार्ट क्या कह रहे हैं!
अमेरिकी बाजार
पिछले सप्ताह हमने अनुमान लगाया था कि डाउजोन्स दबाव की स्थिति में रहेगा और हमने इसी तरह की कीमत कार्रवाई देखी। डाउजोन्स इंडेक्स लगातार 3 सप्ताह से अपने जीवनकाल के उच्चतम स्तर के करीब समेकन चरण में है। चार्ट पर अपट्रेंड के कारण डाउजोन्स को जो मजबूती मिल रही है, वह निर्णायक बिक्री नहीं दिखा रही है और दूसरी ओर, ट्रम्प का आतंक इसे नई ऊंचाइयों की ओर आगे बढ़ने से रोक रहा है। अगर हम इस सप्ताह को देखें, तो डाउजोन्स .55% और 242 अंकों की बढ़त के साथ बंद हुआ, लेकिन चार्ट पर इसकी स्थिति को देखते हुए, किसी भी एकतरफा चाल की भविष्यवाणी करना अभी भी थोड़ा मुश्किल है। अगले सप्ताह भी डाउजोन्स में दोनों तरफ की चाल देखी जा सकती है और नीचे दिए गए स्तरों के पास दोनों दिशाओं में डाउजोन्स का व्यापार करने के लिए तैयार रहना चाहिए। वैश्विक परिस्थितियाँ भी इस ओर इशारा कर रही हैं क्योंकि आप कभी नहीं जानते कि अमेरिकी राष्ट्रपति ट्रम्प द्वारा कब और कौन सा आदेश जारी किया जाएगा, लेकिन बाजार दोनों तरफ ऐसी किसी भी स्थिति से निपटने के लिए तैयार है, जो चार्ट पर भी दिखाई दे रहा है।
संबंधित प्रतिरोध और समर्थन स्तर इस प्रकार हैं:
समर्थन – 44125, 43646, 43247
प्रतिरोध – 44962, 46532
भावना – तटस्थ
रुझान – ऊपर
व्यापार पूर्वाग्रह – दोनों तरफ
भारत बाजार
निफ्टी आउटलुक और व्यापार संभावना
इस सप्ताह निफ्टी ने पिछले दो सप्ताह की मजबूती को पूरी तरह से नष्ट कर दिया। हमने पिछले सप्ताह इसका अनुमान लगाया था और इसका कारण निफ्टी का डाउन ट्रेंड के ऊपरी बैंड के बहुत करीब बंद होना था, और इस सप्ताह यह संदेह वास्तविकता में पुष्टि हो गया। इस सप्ताह निफ्टी ने -2.62% और -619 अंकों की बड़ी गिरावट दिखाई। इसके कारण, जब आप साप्ताहिक चार्ट देखते हैं, तो हैंडओवर, भावना और रुझान सभी कमजोर दिखाई देते हैं। लेकिन इन सबके अलावा, सीखने का दूसरा पहलू यह है कि निफ्टी एक मजबूत समर्थन के पास है जो इसके लिए एक प्रमुख समर्थन के रूप में कार्य करेगा और यदि यह टूट जाता है, तो यह एक नई गिरावट को आमंत्रित करेगा और निफ्टी फ्यूचर चार्ट पर वह समर्थन स्तर 22800 है। अगले सप्ताह के लिए ट्रेडिंग रणनीति को देखते हुए, किसी को दोनों तरफ से ट्रेड करने के अवसरों की तलाश करनी चाहिए। यदि निफ्टी निर्णायक रूप से 22800 से नीचे दिन को बंद करता है, तो हम अपने ट्रेडिंग पूर्वाग्रह को शॉर्ट साइड की ओर बदल देंगे।
संबंधित प्रतिरोध और समर्थन स्तर इस प्रकार हैं:
समर्थन – 22841-807, 22657
प्रतिरोध – 23495, 23589-650, 23870
भावना – कमजोर
प्रवृत्ति – नीचे व्यापार
पूर्वाग्रह – दोनों तरफ (सशर्त)
बैंक निफ्टी आउटलुक और ट्रेड संभावना
बैंक निफ्टी में भी ऐसी ही कहानी देखने को मिली, इस सप्ताह बैंक निफ्टी -2.03% और -1020 अंकों की गिरावट के साथ बंद हुआ। बैंक निफ्टी में दिखाई देने वाली एक असुविधा इसका चार्ट है, जिसमें स्पष्ट प्रवृत्ति गठन दिखाई नहीं देता है; हालांकि प्रवृत्ति, भावना और हैंडओवर सभी कमजोर हैं। चार्ट निर्माण गड़बड़ होने के कारण, हम बैंक निफ्टी इंट्राडे में ही ट्रेड करने की कोशिश करेंगे और नीचे दिए गए स्तरों के पास दोनों तरफ ट्रेड करने के अवसरों की तलाश करेंगे।
संबंधित प्रतिरोध और समर्थन स्तर इस प्रकार हैं:
समर्थन – 48944, 47706, 46184
प्रतिरोध – 49777, 50025, 50325-400
भावना – कमज़ोर
रुझान – नीचे
ट्रेड पूर्वाग्रह – दोनों तरफ (केवल इंट्राडे)
सप्ताह का स्टॉक (लॉन्ग/शॉर्ट)
लॉन्ग साइड ट्रेड
इस सप्ताह हमारे सेटअप में कोई लॉन्ग साइड स्टॉक ट्रेड आइडिया नहीं है और जैसा कि हम हमेशा कहते हैं कि जब आपका सेटअप आपको बेहतर ट्रेड नहीं दे रहा है तो आप ट्रेड लेने से दूर रहें। क्योंकि ट्रेड न लेना भी ट्रेडिंग व्यवसाय में ट्रेड लेने के बराबर है।
शॉर्ट साइड ट्रेड
इस सप्ताह TORNTPHARM हमारे सेटअप में आ रहा है जहाँ हम शॉर्ट साइड ट्रेड शुरू करेंगे। लेवल और चार्ट छवि नकदी स्तरों से है और इसे भविष्य के स्तरों में परिवर्तित करने की आवश्यकता है।
CMP/3013.00 पर बेचें, 3116.00 पर स्टॉप लॉस, 1:2 के जोखिम इनाम अनुपात के साथ 2810.00 पर लक्ष्य
वैकल्पिक निवेश
सोने का आउटलुक और व्यापार संभावना
हमारे पूर्वानुमान के अनुसार पिछले सप्ताह सोने ने अच्छी तेजी दिखाई और व्यापारियों को लॉन्ग साइड पर भी अच्छा लाभ मिला होगा। सोना .77% की बढ़त के साथ $2882.08 पर बंद होने में कामयाब रहा। लेकिन सोने के समापन स्तर और इसकी वृद्धि को देखते हुए अगले सप्ताह के लिए ट्रेडिंग रणनीति बनाना जोखिम भरा हो सकता है। हमारी ट्रेडिंग रणनीति अगले सप्ताह अपने जीवनकाल के उच्च स्तर से लाभ संग्रह के प्रकार की साप्ताहिक मोमबत्ती को देखते हुए एक सतर्क दृष्टिकोण का पालन करना होगा। अगले सप्ताह हम सोने पर तब तक लंबे समय तक बने रहेंगे जब तक कि दैनिक समापन आधार पर $2856 का स्तर टूट न जाए और यदि स्तर टूट जाते हैं तो हम नीचे दिए गए स्तरों के पास दोनों तरफ व्यापार करने के अवसरों की तलाश करेंगे।
संबंधित प्रतिरोध और समर्थन स्तर इस प्रकार हैं:
समर्थन – $2856, $2748, $2684
प्रतिरोध – $2900, $2947
भावना – मजबूत
रुझान – ऊपर
ट्रेड पूर्वाग्रह – लॉन्ग साइड (सशर्त)
चांदी का आउटलुक और ट्रेड संभावना
चांदी की कीमत और क्रिया भी सोने के समान ही रही, लेकिन इसका साप्ताहिक कैंडल गठन बेहतर दिखाई देता है। इसने अच्छे तरीके से उच्च उच्च और उच्च निम्न का गठन किया है और अभी भी अपने जीवनकाल के उच्च स्तर से बहुत नीचे है, जो इसके ऊपर की ओर बढ़ने की संभावना को बेहतर तरीके से पेश कर रहे हैं। लेकिन एक अवलोकन जिसे ध्यान में रखने की आवश्यकता है वह यह है कि चांदी भी सोने की तरह अपने साप्ताहिक उच्च स्तर से बिक्री के दबाव का शिकार हो गई है, जिसके कारण आने वाले सप्ताह के लिए आपकी ट्रेडिंग रणनीति में एक सतर्क दृष्टिकोण लाने की आवश्यकता है। अगले सप्ताह के लिए हमारी ट्रेडिंग रणनीति चांदी के लिए लॉन्ग साइड पर होगी। हम नीचे दिए गए स्तरों के पास चांदी पर लॉन्ग साइड ट्रेड खोजने की कोशिश करेंगे।
संबंधित प्रतिरोध और समर्थन स्तर इस प्रकार हैं:
समर्थन – $31.76, $30.77, $29.89, $29.20
प्रतिरोध – $33.43, $33.79, $34.87, $35.50
भावना – मजबूत
रुझान – ऊपर
व्यापार पूर्वाग्रह – लंबी तरफ
कच्चे तेल (WTI) का दृष्टिकोण और व्यापार संभावना
कच्चे तेल पर इवनिंग स्टार का प्रभाव बरकरार है। इस सप्ताह कच्चे तेल का भाव WTI सूचकांक पर -0.68% की गिरावट के साथ बंद हुआ। यह एक बार फिर साबित हुआ है कि बड़े फ्रेम पर कीमत और कार्रवाई की सफलता की संभावना का प्रतिशत काफी अच्छा है। यदि आप कच्चे तेल के साप्ताहिक चार्ट को देखें, तो आपको शॉर्ट साइड ट्रेड के लिए काफी नजदीकी प्रतिरोध दिखाई देंगे। अगले सप्ताह भी, हम कच्चे तेल को शॉर्ट करने की रणनीति पर ध्यान केंद्रित करेंगे। जब तक कच्चा तेल $66.47 के करीब नहीं आता या $72.42 से ऊपर दैनिक बंद नहीं होता, तब तक हमारा व्यापार पूर्वाग्रह शॉर्ट साइड पर रहेगा।
संबंधित प्रतिरोध और समर्थन स्तर इस प्रकार हैं:
समर्थन – $70.30, $66.47
प्रतिरोध – $72.42, $73.74, $74.26
भावना – कमज़ोर
प्रवृत्ति – नीचे
व्यापार पूर्वाग्रह – शॉर्ट साइड
बिटकॉइन आउटलुक और व्यापार संभावना
बिटकॉइन 3 महीने से अधिक समय से समेकन चरण में है। इसकी अस्थिरता के कारण, आपको बड़े साप्ताहिक उच्च और निम्न स्तर देखने को मिलते हैं, लेकिन यदि आप साप्ताहिक मूल्य और कार्रवाई को ध्यान से देखते हैं, तो आप बिटकॉइन की कीमत $93000 से $104000 के बीच की सीमा में चलते हुए देखेंगे, यह साप्ताहिक आधार पर खुलता और बंद होता है। जैसा कि मैं हमेशा कहता हूँ, बिटकॉइन एक अत्यधिक अस्थिर परिसंपत्ति वर्ग है, जिसकी अस्थिरता को संभालना हर व्यापारी के लिए आसान नहीं है। मेरे अनुसार बिटकॉइन आपके दीर्घकालिक निवेश पोर्टफोलियो का 5% से 10% होना चाहिए और यदि ऐसा नहीं है तो यह अपने समर्थन स्तरों के पास आने पर जमा हो सकता है।
संबंधित प्रतिरोध और समर्थन स्तर इस प्रकार हैं:
समर्थन – $94269, $93336, $90034
प्रतिरोध – $98769, $104454, $113062
भावना – अस्थिर समेकन
प्रवृत्ति – समेकन चरणव्यापार पूर्वाग्रह – लंबा पक्ष
Click Here और अपने पहले स्टॉक, इंडेक्स, कमोडिटी में निवेश करने की अपनी यात्रा शुरू करें और अपनी संपत्ति निर्माण यात्रा को आगे बढ़ाएं।
Click Here और अपनी पहली क्रिप्टो करेंसी में निवेश करने की यात्रा शुरू करें।
निष्कर्ष और अस्वीकरण
MarkShala.com पर सामग्री केवल शैक्षिक और सूचनात्मक उद्देश्यों के लिए है। हम वित्तीय नियोजन, निवेश रणनीतियों, आर्थिक रुझानों और संबंधित विषयों पर ब्लॉग लिखने में माहिर हैं। जबकि हम सटीक और विश्वसनीय जानकारी प्रदान करने का प्रयास करते हैं, सामग्री को पेशेवर वित्तीय, निवेश या कानूनी सलाह के रूप में नहीं लिया जाना चाहिए।
आपको हमारा ब्लॉग कैसा लगा? अपने विचार कमेंट बॉक्स में ज़रूर शेयर करें। आपके विचार हमें आपके लिए और भी अच्छी और प्रासंगिक सामग्री लाने के लिए प्रेरित करेंगे ताकि हम अपनी सामग्री की गुणवत्ता बढ़ा सकें और आपको ज़्यादा फ़ायदा हो सके।
Markshala के फिन डोज़ में शामिल होने के लिए धन्यवाद – वित्तीय बाज़ारों, भारत और वैश्विक अर्थव्यवस्था में अंतर्दृष्टि के लिए आपका आवश्यक स्रोत, इस कहानी को अपने नेटवर्क पर शेयर करना न भूलें।
मार्केटशाला पर और जानें
मार्कशाला पर वैश्विक घटनाओं, बाज़ार विश्लेषण और निवेश रणनीतियों पर अंतर्दृष्टि के साथ अपडेट रहें, जहाँ हमारा लक्ष्य वित्तीय शिक्षा को सुलभ और व्यावहारिक बनाना है। अब, गियर बदलें और आराम करें! Spotify, YouTube और Apple Music पर उपलब्ध MuziMuffin की नवीनतम रिलीज़ के साथ अपने आप को सुखदायक धुनों का आनंद दें। आराम करें, रिचार्ज करें और वाइब का आनंद लें!
***********
|| ॐ नमः शिवाय ||